
Categories
Market UpdatesPublished September 10, 2026
El Dorado Hills Real Estate Market Report September 2026

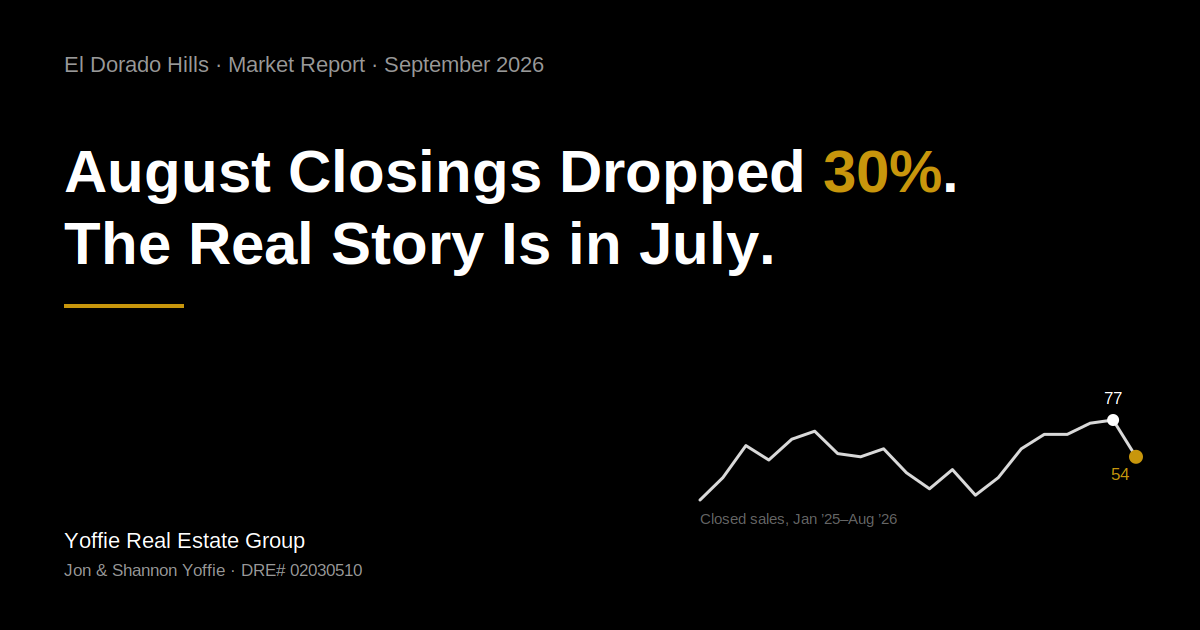
August Closings Dropped 30%. The Real Story Is in July.
Fifty-four homes closed in El Dorado Hills in August. In July it was seventy-seven. That's a 30% drop in a single month, and if you saw that number on its own, you'd be forgiven for thinking something changed. Something did change, but not what most people assume.
Market Report · El Dorado Hills · By Jon Yoffie, Yoffie Real Estate Group · DRE# 02030510 · Data as of September 8, 2026
Where the Market Stands Right Now
- 190 active listings, down from 214 in June
- 2.7 months of supply, down from 4.0 in June
- 27% pending ratio, down from 36% in June
- 69 days on market for active listings
- 98.9% of list price on homes that closed over the past six months
- $1,104,818 average sold price over the past six months
Why August Looks Weak, and Why That's Backwards
Closed sales in this market follow one thing more closely than anything else: how many homes went pending the month before. I lined up nineteen months of data, June's pending count against July's closings, July's against August's, and so on back through last January. The two numbers track each other almost exactly, month after month.
June had 86 pending contracts, the most of any month this year. Those worked through escrow and closed in July, which is why July's 77 sales was the strongest month of 2026 so far. July's pending pool cooled to 61. That's what closed in August. The 54 homes that sold last month aren't a sign buyers disappeared. They're the tail end of a smaller group of contracts written a month earlier.
Want a cleaner read on whether the market actually slowed? Compare August to August instead of July to August. Fifty-four homes closed in August 2025. Fifty-four closed in August 2026. Same number, one year apart.
None of this means August was a completely ordinary month. Going back to 2019, July-to-August has never dropped this hard in percentage terms before, most years land somewhere between a 13% decline and a 25% increase. Raw percentage swings on a market this size get noisy fast, but the pending data accounts for nearly all of it.
What doesn't have as clean an explanation is months of supply. In three of the last four years, supply held flat or eased slightly from July to August. This year it moved the other way, from 3.0 months to 3.6. It's a small shift, but it's the one number in this report that isn't fully explained by the pending pipeline, and it's worth watching into September.
For what it's worth, August's own pending count already climbed back to 69, well above July's 61. If the same pattern holds, September's closings should move back toward the high 60s or low 70s rather than keep falling.
What's Happening by Price Point
Under $2 million is still the tightest part of this market by a wide margin. Months of supply sits at 2.3, right where it's been sitting since spring. If you've read one of these reports in the last few months, that part isn't new.
What has changed is the middle of the market above $2 million. Back in June, we called out the $3M–$3.5M band specifically: 20 months of supply, homes closing at 89% of list. Neither number looked good. Since then, that band has cut its months of supply to 8 and pushed its list-price capture up to nearly 96%. The $3.5M–$4M range moved the same direction, supply down from almost 27 months to 12. These bands are small enough that a sale or two can swing the numbers a lot, so treat this as a real shift worth watching rather than a settled trend. But it's a real shift.
Above $5 million, activity stayed close to nonexistent this period. That segment runs on its own timeline, and a handful of homes don't tell you much about the broader market.
Bottom Line
The headline number, closings down 30% from July to August, is real. But it's mostly math working through a pipeline, not a change in how buyers are behaving. The number that actually deserves your attention is the small uptick in months of supply. One month isn't a trend. If it continues into September, that's the story worth revisiting.
Curious what any of this means for your specific street or price point? The Smart Seller Pricing System™ runs your address against this data directly.
Common Questions About the El Dorado Hills Market Right Now
Did the El Dorado Hills housing market slow down in August 2026?
Closed sales fell 30% from July to August, but the drop tracks almost exactly with a smaller pool of pending contracts written in July. August 2026 closings (54) matched August 2025 (54) exactly, so the year-over-year pace held steady.
Is El Dorado Hills a buyer's market or a seller's market right now?
It depends heavily on price point. Under $2 million, 2.3 months of supply puts sellers in a strong position. Above $2 million, supply runs from roughly 6 to 12 months depending on the band, which favors buyers.
What is the average home price in El Dorado Hills?
The average sold price over the trailing six months (March through August 2026) is $1,104,818, with homes closing at 98.9% of list price.
Should sellers wait for the market to "recover" from August's dip?
Based on the pending pipeline, there isn't a dip to recover from in the way the headline number suggests. September's pending count is already running ahead of August's, which points to closings picking back up rather than continuing to slow.
Full Price Band Breakdown — Data as of September 8, 2026
| Price Range | Active | Pending | Pend. Ratio | Sold (6mo) | DOM Sold | % List | Mo. Supply |
|---|---|---|---|---|---|---|---|
| $0–$750K | 35 | 13 | 37% | 110 | 38 | 99.0% | 1.9 |
| $750K–$1M | 59 | 13 | 22% | 138 | 36 | 99.3% | 2.6 |
| $1M–$1.25M | 17 | 7 | 41% | 60 | 31 | 98.6% | 1.7 |
| $1.25M–$1.5M | 16 | 8 | 50% | 43 | 27 | 99.9% | 2.2 |
| $1.5M–$1.75M | 15 | 4 | 27% | 23 | 60 | 99.2% | 3.9 |
| $1.75M–$2M | 8 | 2 | 25% | 12 | 46 | 97.8% | 4.0 |
| Under $2M Totals | 150 | 47 | 31% | 386 | 36 | 99.1% | 2.3 |
| $2M–$2.5M | 7 | 1 | 14% | 11 | 36 | 97.6% | 3.9 |
| $2.5M–$3M | 8 | 2 | 25% | 9 | 48 | 94.7% | 5.3 |
| $3M–$3.5M | 8 | 0 | 0% | 6 | 49 | 95.7% | 8.0 |
| $3.5M–$4M | 6 | 1 | 17% | 3 | 11 | 97.6% | 12.0 |
| $4M–$4.5M | 6 | 1 | 17% | 2 | 14 | 97.4% | 20.0 |
| $2M–$5M Totals | 36 | 5 | 14% | 31 | 38 | 96.4% | 6.9 |
| Market Totals | 190 | 52 | 27% | 417 | 36 | 98.9% | 2.7 |

Shannon and Jon Yoffie
Co-Founders | Yoffie Real Estate Group | Keller Williams
or another way