
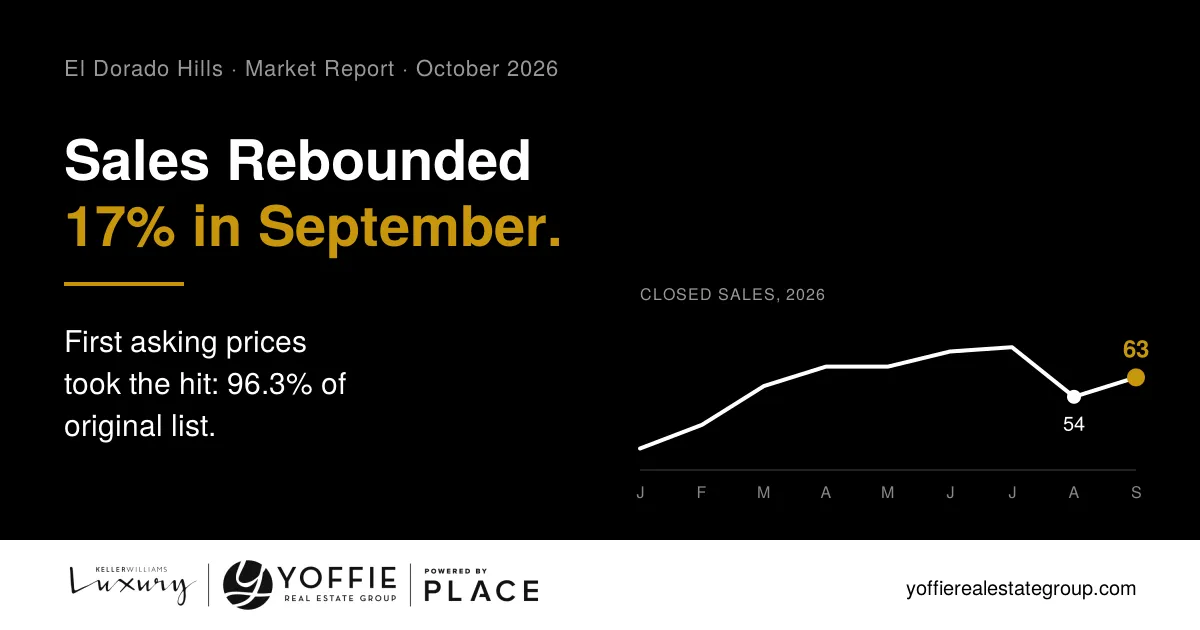
Sales Rebounded 17% in September. Initial Asking Prices Aren't Holding Up
By Shannon and Jon Yoffie, Yoffie Real Estate Group · Data as of October 11, 2026 · Sources: MLS and REMO/AreaPro
This is our October 2026 monthly snapshot. For the newest numbers, updated every month, see our live El Dorado Hills market data page.
63 homes closed in El Dorado Hills in September, up from 54 in August and ahead of the 59 we closed in September 2025. Through nine months, 535 homes have sold here, 10% more than this point last year and 24% more than 2024. Buyers are showing up.
What they won't do is pay the first price on the listing: September homes sold at 95% of their original list price, down from 98% in August, and they took 48 days to sell, the slowest September in the eight years of data we track. This is largely because buyers are waiting for price drops rather than submit a "lowball" offer.
If you're thinking about listing this fall, that gap between the first listing price and the one that sells is what costs time and money. Before you pick a number, request a Smart Pricing Analysis and see where your home falls in today's demand bands.
This month's rebound showed up exactly where we expected it would
Last month we wrote that August's 30% drop in closings was due to timing. A strong July stole sales from August. August ended with 69 homes in contract. September closed 63. We'd projected September closings in the high 60s, so our forecast was a few homes short. This fits a pattern: over the last 32 months, closings have come in about four homes under the prior month's pending count, since some deals slip a month and some fall apart.
The number we were watching most closely was months of supply. After climbing from 3.0 months to 3.6 in August. It dropped back to 2.8 in September. That speaks to our market remaining healthy and balanced.
September ended with 60 homes in contract. Using the same math, expect something in the mid-50s for October closings. That's a step down from September, completely normal for this time of year, still well above the 44 homes that closed last October.
El Dorado Hills home prices: more sales, flatter prices
This year has brought more transactions at about the same money. Price per square foot on September sales was $375, compared with $395 a year ago. The median sale was $994,000, close to last September's $1,010,000. Monthly price figures in a market this size jump around depending on which homes happen to close, so I wouldn't read a trend into one month. Over the full year, the volume is up and prices are holding steady.
The part that stands out is the distance between what's listed and what sells. The average active listing is priced at $1,577,000. The average September sale was $1,119,000. That $458,000 spread is the widest for any September in our records. The medians tell a calmer story, $1,100,000 asking against $994,000 sold, which tells me most of that spread comes from expensive homes that have been sitting on the market for a while.
Over the last three months
$47,198
is the average difference between where El Dorado Hills sellers first listed ($1,195,991) and where they closed ($1,148,793). Homes sold at 98.6% of their final price but only 96.3% of their original one. Most of that movement happens between the original listing price and the one that attracts an offer.
Price bands where homes are moving - and where they are waiting
Below $1.25 million, homes are moving at a steady clip. Each of the three bands there carries less than three months of supply and closes at about 99% of list. The $750,000 to $1 million range is the busiest part of the market, with 55 homes for sale, 18 in contract, and nearly 19 sales a month.
The one band that seems unusually slow is from $1.25 million to $1.5 million. It has 20 active listings and only 2 in contract. Listings have been on the market for an average of 68 days. Homes in that range that did sell went at 98.9% of list in 35 days, so buyers will pay there for the right house at the right price. They're willing to be patient and are waiting for homes and prices that meet their expectations. If your home falls in that window, whether it's in Serrano, Blackstone, or Highland View, the first two weeks on the market are telling you a story sellers need to pay attention to.
From $1.75 million to $2 million the pace slows to 5.3 months of supply, and above $2 million the market has 6.0 months of supply with homes selling at 96.8% of list. The $3 million to $3.5 million band sold at 99.1% of list, but the 8 homes still active there have been listed for an average of 108 days.
| Price band | Active | Pending | Months of supply | % of list |
|---|---|---|---|---|
| Under $750K | 34 | 12 | 2.2 | 98.7% |
| $750K to $1M | 55 | 18 | 2.9 | 99.0% |
| $1M to $1.25M | 26 | 8 | 2.4 | 99.0% |
| $1.25M to $1.5M | 20 | 2 | 3.5 | 98.9% |
| $1.5M to $1.75M | 13 | 2 | 3.0 | 97.8% |
| $1.75M to $2M | 9 | 3 | 5.3 | 97.9% |
| $2M to $5M (combined) | 32 | 4 | 6.0 | 96.8% |
Active and pending as of October 11, 2026. Months of supply and % of list are based on sales from July 12 to October 11, 2026. Our September report used a six-month window, so compare bands between the two reports as direction, not exact change.
What this means if you're selling or buying this fall
Sellers, the market has the buyers. In the El Dorado Hills housing market right now, the risk is an aspirational initial price that sits for three weeks and then needs a cut. Overpricing won't just force your price down, it also comes with an extra month or months of showings and expenses. Sellers would be wise to avoid the price high and hope strategy in this market - buyers are looking for the best house in their price band. Study recent sales and your current competition, pricing where it belongs gives you best shot at selling quickly and at the best price.
Buyers, the fall and winter months have historically been the best time of year to negotiate. Over the past year, homes that closed from October through January sold at 94% to 96% of their original list price, the softest stretch of the year. New listings also thin out fast after October, often meaning sellers this time of year want to sell. If you see the right house in the next few weeks, don't be shy about offering aggressively.
You can follow the numbers month to month on our live El Dorado Hills market data page, read last month's breakdown in the September 2026 El Dorado Hills market report, or browse El Dorado Hills homes for sale.
Common questions about the El Dorado Hills real estate market this month
Is the El Dorado Hills housing market slowing down this fall?
By sales volume, no. El Dorado Hills closed 63 homes in September 2026, up 17% from August and up 7% from September 2025. Through September, 535 homes have sold this year, 10% more than the same period in 2025. Pricing is where it's softer: September sales closed at 95% of their original list price and took an average of 48 days.
How far below asking are El Dorado Hills homes selling?
Over the three months ending October 11, 2026, homes sold at 98.6% of their final list price and 96.3% of their original list price. The average home was first listed at $1,195,991 and sold for $1,148,793, a difference of about $47,000, most of it from price reductions made before an offer came in.
Which El Dorado Hills price ranges are selling fastest?
Homes under $1.25 million are moving fastest, with 2.2 to 2.9 months of supply and sales at about 99% of list price. The $1.25 million to $1.5 million range is slower, with 20 active listings and 2 pending. Above $2 million, supply runs about 6 months and homes sell at 96.8% of list.
How many El Dorado Hills homes should close in October 2026?
September ended with 60 homes under contract. Closings here usually run about four homes below the prior month's pending count, which points to roughly 55 closings in October 2026, down from September but above the 44 homes that closed in October 2025.
The first price you pick decides most of what you keep. Let's set it with the numbers.
Request a Smart Pricing AnalysisData notes: Monthly figures from MLS records for El Dorado Hills, January 2019 through September 2026. Price-band, list-to-sale, and inventory figures from REMO/AreaPro, data as of October 11, 2026. Yoffie Real Estate Group, 4359 Town Center Blvd, Ste 217, El Dorado Hills, CA 95762. Jon Yoffie, CA DRE# 02030510.
