
Categories
Market UpdatesMarket Report · El Dorado Hills · August 10, 2026
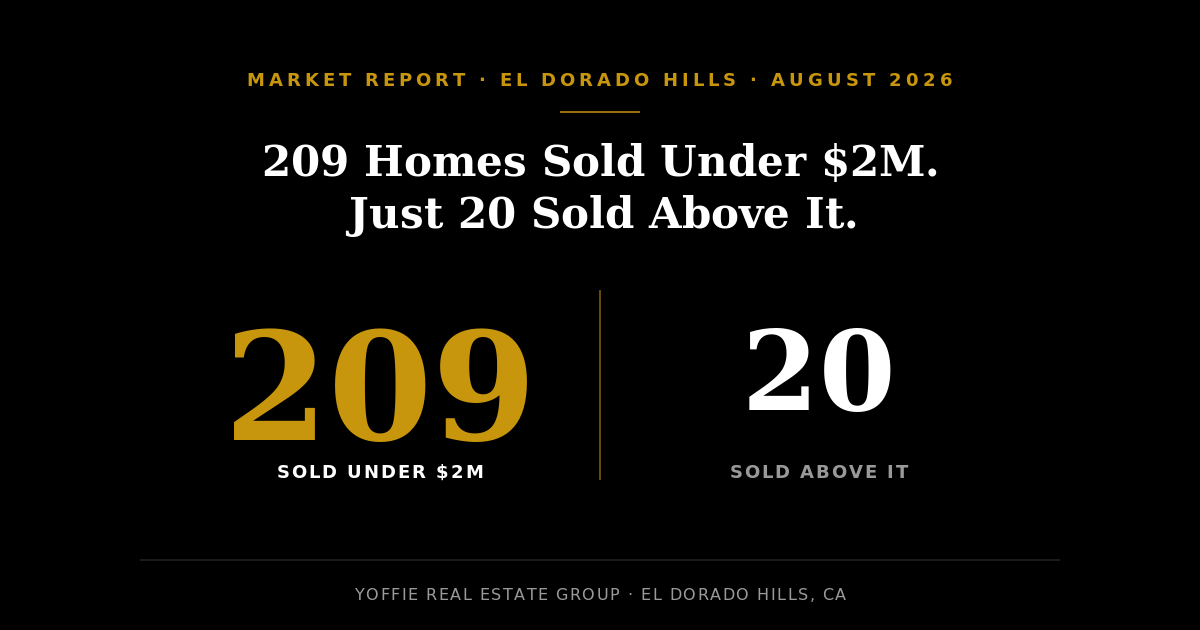
209 Homes Sold Under $2M This Quarter. Just 20 Sold Above It.
By Shannon and Jon Yoffie | Yoffie Real Estate Group | DRE# 02030510 | Data as of August 9, 2026
This month’s El Dorado Hills real estate market report starts with a gap too wide to ignore. Over the trailing three months (May 10 – August 9, 2026), 229 homes sold in El Dorado Hills. 209 of them closed under $2M. Only 20 closed above it. That split describes this market better than any single headline number could.
The two tiers sit inside the same zip code, but they are not moving at anything close to the same speed. Under $2M, El Dorado Hills is carrying 2.3 months of supply as of August 9, 2026, tight enough that well-priced homes are gone before most sellers finish deciding whether to negotiate. From $2M to $5M, supply stretches to 6.4 months. Above $5M, nothing closed at all in three months.
Which side of that line your home falls on changes the entire pricing conversation. Request a Smart Pricing Analysis to see exactly where your home’s price point sits in today’s demand bands, and what that means for how you price it.
209 homes sold under $2M in El Dorado Hills over the past three months. 20 sold above it. Both groups are selling in the same market, at wildly different speeds.
The Headline Numbers for El Dorado Hills (August 2026)
Six metrics define the El Dorado Hills real estate market this month. Each one is reported below as a standalone fact, with the source period attributed.
- Active listings: As of August 9, 2026, there are 210 active listings in El Dorado Hills.
- Pending sales: 56 homes are under contract as of August 9, 2026, a 27% pending ratio against active inventory.
- Months of supply: El Dorado Hills has 2.8 months of supply as of August 9, 2026, a seller-leaning market overall.
- Average sold price: Homes that sold in El Dorado Hills over the past three months (May 10 – August 9, 2026) averaged $1,116,525.
- Average days on market (sold): Sold homes averaged 37 days on market over the trailing three-month period.
- Percent of list price: Sellers in El Dorado Hills received an average of 99.0% of final list price and 97.8% of original list price over the past three months.
Two of those numbers deserve a second look before you read this as one flat market. Active listings climbed from 199 in July to 210 in August, but the pending ratio dropped from 39% to 27% over the same stretch. More homes came on the market. Fewer of them, proportionally, went under contract. That has not yet shown up in months of supply, which only ticked up a tenth of a point, from 2.7 in July to 2.8 in August, but it is a number worth watching over the next report.
Why Did 209 Homes Sell Under $2M in El Dorado Hills, and Only 20 Sell Above It?
Because supply and demand are moving at almost nothing alike on either side of that line. Sub-$2M inventory in El Dorado Hills is running 2.3 months of supply as of August 9, 2026, while the $2M to $5M tier is sitting at 6.4 months, and the market above $5M has produced zero closings in three months.
Under $2M, 209 homes closed against 162 active listings, a pace of 2.3 months of supply. That means the entire current shelf of active listings under $2M would clear in about 10 weeks if nothing new came on the market. From $2M to $5M, 20 homes closed against 43 active listings, a pace of 6.4 months of supply, nearly three times as long to clear the same shelf.
Above $5M, there is no pace to measure. Five homes are active, none are pending, and none have sold since May. The gap is not a matter of degree. It is two different markets sharing a mailing address.
Jon and Shannon Yoffie of Yoffie Real Estate Group track this split every month in El Dorado Hills, because it changes what “the market” actually means depending on what you are buying or selling. A citywide absorption rate of 36.3% undersells how fast the entry and move-up tiers are moving. It is being pulled down almost entirely by a top of market that has stopped moving.
El Dorado Hills Home Prices by Demand Band: August 2026
Here is how every price band performed over the trailing three months (May 10 – August 9, 2026).
| Price Band | Active | Pending | Pending % | Sold (3 mo) | % of List | Months Supply |
|---|---|---|---|---|---|---|
| $0 - $750K | 33 | 13 | 39% | 61 | 98.8% | 1.6 |
| $750K - $1M | 67 | 12 | 18% | 82 | 99.7% | 2.5 |
| $1M - $1.25M | 25 | 11 | 44% | 29 | 99.3% | 2.6 |
| $1.25M - $1.5M | 17 | 8 | 47% | 18 | 99.0% | 2.8 |
| $1.5M - $1.75M | 13 | 4 | 31% | 12 | 98.8% | 3.3 |
| $1.75M - $2M | 7 | 4 | 57% | 7 | 98.1% | 3.0 |
| Under $2M Total | 162 | 52 | 32% | 209 | 99.2% | 2.3 |
| $2M - $2.5M | 8 | 0 | 0% | 8 | 98.4% | 3.0 |
| $2.5M - $3M | 8 | 2 | 25% | 6 | 93.9% | 4.0 |
| $3M - $3.5M | 13 | 1 | 8% | 1 | 98.4% | 43.3 |
| $3.5M - $4M | 7 | 1 | 14% | 3 | 97.6% | 7.0 |
| $4M - $4.5M | 6 | 0 | 0% | 2 | 97.4% | 8.6 |
| $4.5M - $5M | 1 | 0 | 0% | 0 | n/a | n/a |
| $2M - $5M Total | 43 | 4 | 9% | 20 | 96.8% | 6.4 |
| $5M - $6M | 2 | 0 | 0% | 0 | n/a | n/a |
| $6M+ | 3 | 0 | 0% | 0 | n/a | n/a |
| $5M+ Total | 5 | 0 | 0% | 0 | n/a | n/a |
A few things stand out band by band.
The $750K-$1M band did more work than any other segment in the market. It closed 82 sales over the trailing three months, more than any other band, including the less expensive $0-$750K tier. It did that at 99.7% of list price, the highest ratio anywhere in El Dorado Hills right now, on just 2.5 months of supply.
The tightest supply in the entire market is actually one band down. $0-$750K is running 1.6 months of supply, the lowest number on the table, even though its 98.8% list price ratio trails the band just above it. Scarce and fast are not always the same thing.
$2.5M-$3M is the one band giving up real money. Homes there closed at 93.9% of list price over the trailing three months, the weakest ratio on the entire table, well below the 97% to 99% sellers are getting in nearly every band above and below it.
Why El Dorado Hills Luxury Listings Look Slower Than They Actually Are
Homes priced above $3M in El Dorado Hills that actually sell are closing in 8 to 14 days. It is the listings still sitting, some for 100 days or more, that make the entire luxury segment look frozen.
Look at the $3M-$3.5M band: 13 active listings averaging 107 days on market, but the one home that sold over the trailing three months closed in 8 days. The $3.5M-$4M band shows the same shape: 124 days on market for active listings, 11 days for the three that sold. $4M-$4.5M: 52 days for active listings, 14 days for the two that sold.
That pattern holds across every band above $3M in El Dorado Hills. The homes that transact are not slow. They are moving nearly as fast as anything under $1M. It is the overpriced listings sitting for months that drag the average down and make the whole tier look stalled.
This is exactly the gap the Smart Seller Pricing System™ is built to catch. A demand-band pricing analysis shows a seller whether their number sits inside the range where buyers are actually transacting, or inside the range where listings go to wait. Request a Smart Pricing Analysis before setting a number above $3M in this market.
What This Means If You’re Selling in El Dorado Hills Right Now
If your home falls under $2M, the data argues for pricing at the market and listing now. Supply is tight, 209 homes changed hands over the past three months, and buyers are showing up ready to act.
If you are above $3M, speed is still available. It is just conditional on price. The homes closing in 8 to 14 days in this report were not lucky. They were priced inside the demand band buyers in that range are actually shopping.
Jon Yoffie and Shannon Yoffie of Yoffie Real Estate Group publish this El Dorado Hills market report every month, and the gap between priced-right and stale luxury listings has held for several months running, including in the July 2026 report.
What Buyers Should Watch in the El Dorado Hills Market Right Now
Under $1M, you are in the most competitive part of the market. The $750K-$1M band alone absorbed 82 sales over three months at 99.7% of list price. Have financing ready and move quickly on anything priced well.
Above $3M, leverage is still yours, if you are patient. Several active listings in that range have sat for 100 days or more, and sellers there are working with far less certainty than they were a year ago. Browse current El Dorado Hills listings here.
Frequently Asked Questions About the August 2026 El Dorado Hills Market
Why did 209 homes sell under $2M in El Dorado Hills while only 20 sold above it?
Because supply and demand are moving at completely different speeds on either side of that line. Under $2M, El Dorado Hills had 2.3 months of supply over the trailing three months (May 10 – August 9, 2026), tight enough that 209 homes changed hands in that window. From $2M to $5M, supply stretched to 6.4 months, and only 20 homes closed in the same period. Above $5M, no homes sold at all. The split reflects how few buyers are actively shopping above $2M compared to how many are competing for everything below it.
What is the current average home price in El Dorado Hills as of August 2026?
Homes that sold in El Dorado Hills over the trailing three months (May 10 – August 9, 2026) averaged $1,116,525, with sellers receiving 99.0% of final list price and 97.8% of original list price. The average price of homes currently listed for sale is $1,635,864, a number pulled higher by unsold inventory above $2M rather than by what is actually trading day to day.
How long does it take to sell a home in El Dorado Hills right now?
Sold homes in El Dorado Hills averaged 37 days on market over the trailing three months ending August 9, 2026. Under $2M, most bands are selling in 30 to 50 days. Above $3M, the picture splits: homes that actually sell close in 8 to 14 days, while unsold active listings in the same bands average well over 100 days.
Is El Dorado Hills a buyer’s market or seller’s market in August 2026?
It depends on price. Under $2M, El Dorado Hills is a seller-leaning market with 2.3 months of supply and a 32% pending ratio as of August 9, 2026. From $2M to $5M, it is a buyer-leaning market with 6.4 months of supply. Above $5M, there has been no market activity at all in three months, no pending contracts and no closings.
Which El Dorado Hills price band sold the most homes this quarter?
The $750K-$1M band led the market with 82 sales over the trailing three months (May 10 – August 9, 2026), more than any other price band, including the less expensive $0-$750K tier. It also closed at 99.7% of list price, the highest ratio in the entire market, on just 2.5 months of supply.
Why do El Dorado Hills luxury listings sit on the market for months?
Not because buyers above $3M have disappeared. Homes in that range that actually sell are closing in 8 to 14 days, nearly as fast as entry-level inventory. The listings sitting for 100 days or more are typically priced above where the data shows real buyer activity. Jon Yoffie of Yoffie Real Estate Group recommends a Smart Pricing Analysis for any listing above $3M to see exactly where current demand sits before setting a number.
The Bottom Line for August 2026
El Dorado Hills is not one market right now. It is two, sharing a set of city limits. Under $2M, 209 sales in three months and 2.3 months of supply describe a market moving fast and pricing close to full value. Above $2M, 20 sales and stretched-out supply describe something closer to a holding pattern, one that gets worse the higher up the price ladder you go.
Average sold price over the trailing three months came in at $1,116,525, up from $1,047,846 in July’s report, another sign the recovery under $2M is real. Jon Yoffie and Shannon Yoffie of Yoffie Real Estate Group publish this El Dorado Hills market report monthly using the Smart Seller Pricing System™ framework, because the number that matters for your home is not the citywide average. It is the demand band you are actually in.
Evidence, not opinion.
See exactly where your home’s price point sits in today’s demand bands before you list.
Data source: AreaPro Market Reports for El Dorado Hills, CA, as of August 9, 2026, and the Yoffie Real Estate Group El Dorado Hills Market Report published July 8, 2026. Active, pending, and months-of-supply metrics are point-in-time as of August 9, 2026. Sold price, days on market, percent of list, and sold-per-month metrics represent the trailing three-month period (May 10 – August 9, 2026) unless otherwise noted as sourced from the July report’s trailing three-month window.
About the author: Shannon and Jon Yoffie are founders of Yoffie Real Estate Group at 4359 Town Center Blvd, Ste 217, El Dorado Hills, CA 95762. They publish the El Dorado Hills market report monthly and developed the Smart Seller Pricing System™ used by the team. Reach Shannon and Jon at (916) 941-6566 or theyoffies@yoffierealestate.com.
