


Categories
AdvisoryHow to Read a Comparative Market Analysis Like an Agent Does
By Shannon and Jon Yoffie, Yoffie Real Estate Group – El Dorado Hills, CA
Most comparative market analyses show you the same thing: three to six recent sales, adjusted up or down for size and features, landing on a number. That is not how to read a comparative market analysis the way an agent actually reads one. An agent is reading two more data sets most CMAs leave out entirely: how many homes are competing for buyers right now, and how many just went under contract.
We built the Smart Seller Pricing System™ around exactly that gap. If you want to see it applied to your own address rather than a general example, request a Smart Pricing Analysis. Everything below uses real El Dorado Hills numbers as of July 23, 2026, so you can see the method in action.
This matters whether you are selling or buying. A seller who cannot read the gaps in a CMA prices from hope. A buyer who cannot read them either overpays for a home that looks scarce or walks away from one that was never actually competitive.
What Is Actually Different Between a CMA and a Demand-Band Analysis?
A standard CMA anchors on a handful of recent closed sales and adjusts for square footage, lot size, and condition. A demand-band analysis adds the data a closed-sale list cannot show you: active listings and pending sales in the exact same price range, right now. That turns a backward-looking comp sheet into a forward-looking read on how buyers are actually behaving in your price range today.
Skill 1: Check the Sample Size Behind Any Percentage
As of July 23, 2026, the $1.75 million to $2 million range in El Dorado Hills has a 56% pending ratio, the highest of any band under $2 million. Read at face value, that looks like the hottest price point in the market.
Look at the count behind it: 9 active listings and 5 pending. One buyer backing out of one deal would drop that ratio from 56% to 44%. Compare it to the $750,000 to $1 million range, where a 38% pending ratio is built on 58 active listings and 22 pending sales, a sample five times larger. The lower percentage is the more reliable number. An agent reads the count before trusting the percentage. A CMA that only reports the percentage is handing you a coin flip dressed up as a statistic.
Skill 2: Months of Supply Beats a Single Comp Every Time
El Dorado Hills as a whole is carrying 3.0 months of supply as of July 23, 2026. If a CMA hands you that one blended number and stops, you would assume your home, wherever it falls, is sitting in a fairly balanced market.
Break it out by price range and the picture changes. The under $2 million segment overall is at 2.6 months of supply, but the $1 million to $1.25 million band specifically is sitting at 4.3 months, well above the blended average for homes under $2 million. A CMA that quotes the countywide or under-$2M number without isolating your specific band can make a slower-moving price point look tighter than it is, or a competitive one look slower than it is. Always ask which band the number actually describes.
Skill 3: Days on Market Sold vs. Active Tell Different Stories
The $1.5 million to $1.75 million range shows something that looks contradictory at first glance: homes that sold in this band over the trailing three months averaged 90 days on market, by far the slowest closing timeline of any band under $2 million. Yet the band is carrying just 2.6 months of supply and homes are closing at 99.2% of list price.
A CMA that only flags the 90-day figure would read this band as underperforming. It is not. Only 13 homes sold in this range over three months, a small, patient buyer pool that takes longer to decide but ultimately pays close to full price once they commit. That is a negotiation timeline, not a pricing problem. Reading days on market without reading it alongside sold volume and percent of list price is how a CMA turns a normal pattern into a false warning sign.
9 active listings. 5 pending. A 56% pending ratio that means almost nothing without the count behind it.
Skill 4: A Single Price Isn't a Forecast. A Range With Probabilities Is.
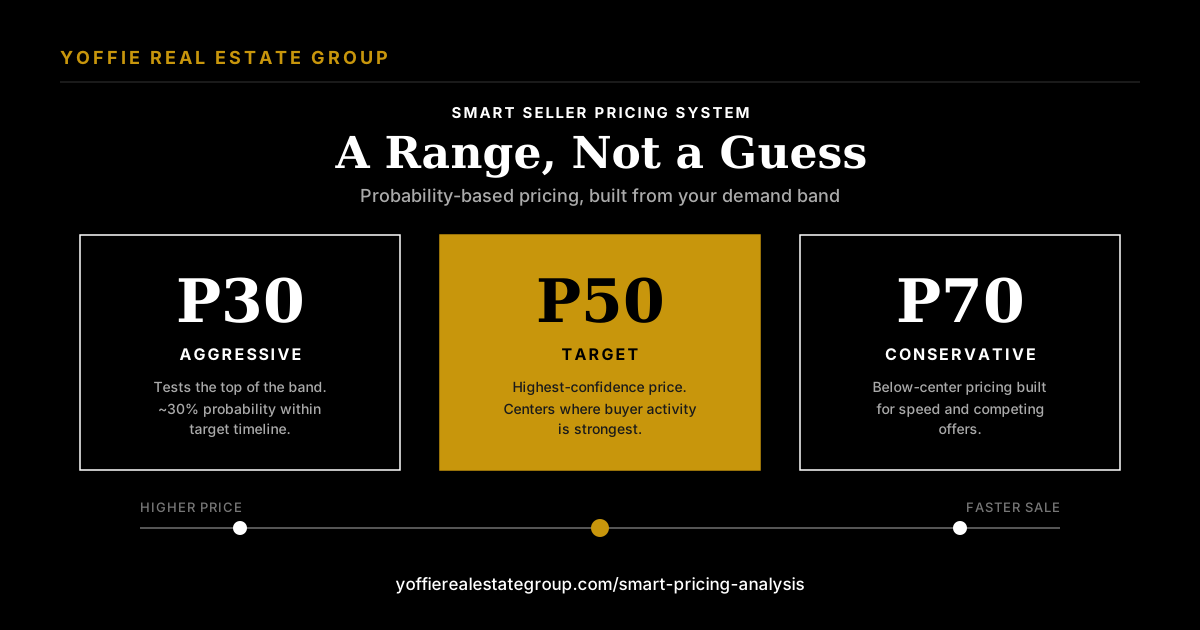
This is the step that separates a comp sheet from the Smart Seller Pricing System™. Instead of handing you one number, we build three:
- P30, Aggressive: a higher price with roughly a 30% probability of selling within your target timeline. Tests the top of your demand band.
- P50, Target: the highest-confidence price point, centered where buyer activity in your band is strongest.
- P70, Conservative: below-center pricing designed to generate urgency and competing offers, a speed-first strategy.
Behind that range sits an analysis of more than 15 factors a standard CMA misses: view premiums calibrated by neighborhood, custom features that add or subtract value, lot characteristics, recent updates, and market-tier weighting, since a pool adds different value in a $950,000 home than it does in a $2 million home. You get a complete picture, not a comp sheet.
What This Means If You're Buying or Selling in El Dorado Hills
If you're selling, knowing which band you're actually in tells you whether 90 days on market is a red flag or completely normal for your price point. If you're buying, reading a demand band correctly tells you whether a 99% list-to-sale ratio in a slow-DOM band means real room to negotiate, or a seller who simply isn't in a hurry. Either way, the raw comps never tell you that. The demand band does.
We've applied this same demand-band thinking to the broader El Dorado Hills market in our posts on pricing your home right in El Dorado Hills and our March 2026 demand bands breakdown. This post is the piece underneath both of those: the actual reading skills, so you can apply them to any CMA someone hands you, not just ours.
See Your Actual Demand Band, Not Just a Comp Sheet
We'll build the P30, P50, and P70 range for your specific address, using the same data behind every number in this post.
Request a Smart Pricing AnalysisFrequently Asked Questions
What is a comparative market analysis (CMA)?
A CMA is a report agents use to estimate a home's value by comparing it to similar recently sold properties, adjusted for differences in size, condition, and features. Most CMAs stop there, at closed sales, without factoring in current active competition or pending activity.
Why isn't a CMA enough to determine my home's true value?
A CMA built only on past sales tells you what already happened. It does not tell you how many homes are competing with yours right now or how fast buyers in your specific price range are currently moving. Those two data points, active listings and pending sales, are what turn a backward-looking comp sheet into a forward-looking demand-band analysis.
What is a demand band in real estate?
A demand band is the specific price range where a concentration of active buyers is shopping for a given home type and neighborhood. As of July 23, 2026, El Dorado Hills homes under $2 million are carrying 2.6 months of supply while homes between $2 million and $5 million are carrying 8.3 months, evidence that a single price range and its neighboring bands can behave like entirely different markets.
What is P30, P50, P70 pricing?
P30, P50, and P70 are probability-based price points the Smart Seller Pricing System™ builds instead of a single list price. P30 is an aggressive, higher price with roughly a 30% probability of selling within a target timeline. P50 is the highest-confidence target price, centered where buyer activity is strongest. P70 is a conservative, below-center price designed to generate urgency and competing offers.
How can I tell if a pending ratio is reliable?
Check the count behind the percentage, not just the percentage itself. A 56% pending ratio built on 9 active listings can swing 12 points with a single contract falling through. A 38% pending ratio built on 58 active listings is far more stable, even though the number itself is lower.
Should buyers use a CMA too, not just sellers?
Yes. A buyer reading a CMA or a demand-band analysis correctly can tell whether a home priced near full list is genuinely scarce or simply sitting in a band with a patient, slower-moving buyer pool, which changes how much negotiating room actually exists.
Data source: AreaPro Real Estate Market Overview, El Dorado Hills, as of July 23, 2026, provided by Shannon and Jon Yoffie, Yoffie Real Estate Group. Active listings, pending counts, pending ratio, and months of supply are point-in-time. Sold price, days on market (sold), sold volume, and percent of list price reflect the trailing three-month period, April 24 through July 23, 2026.
