Categories
AdvisoryPublished February 24, 2026
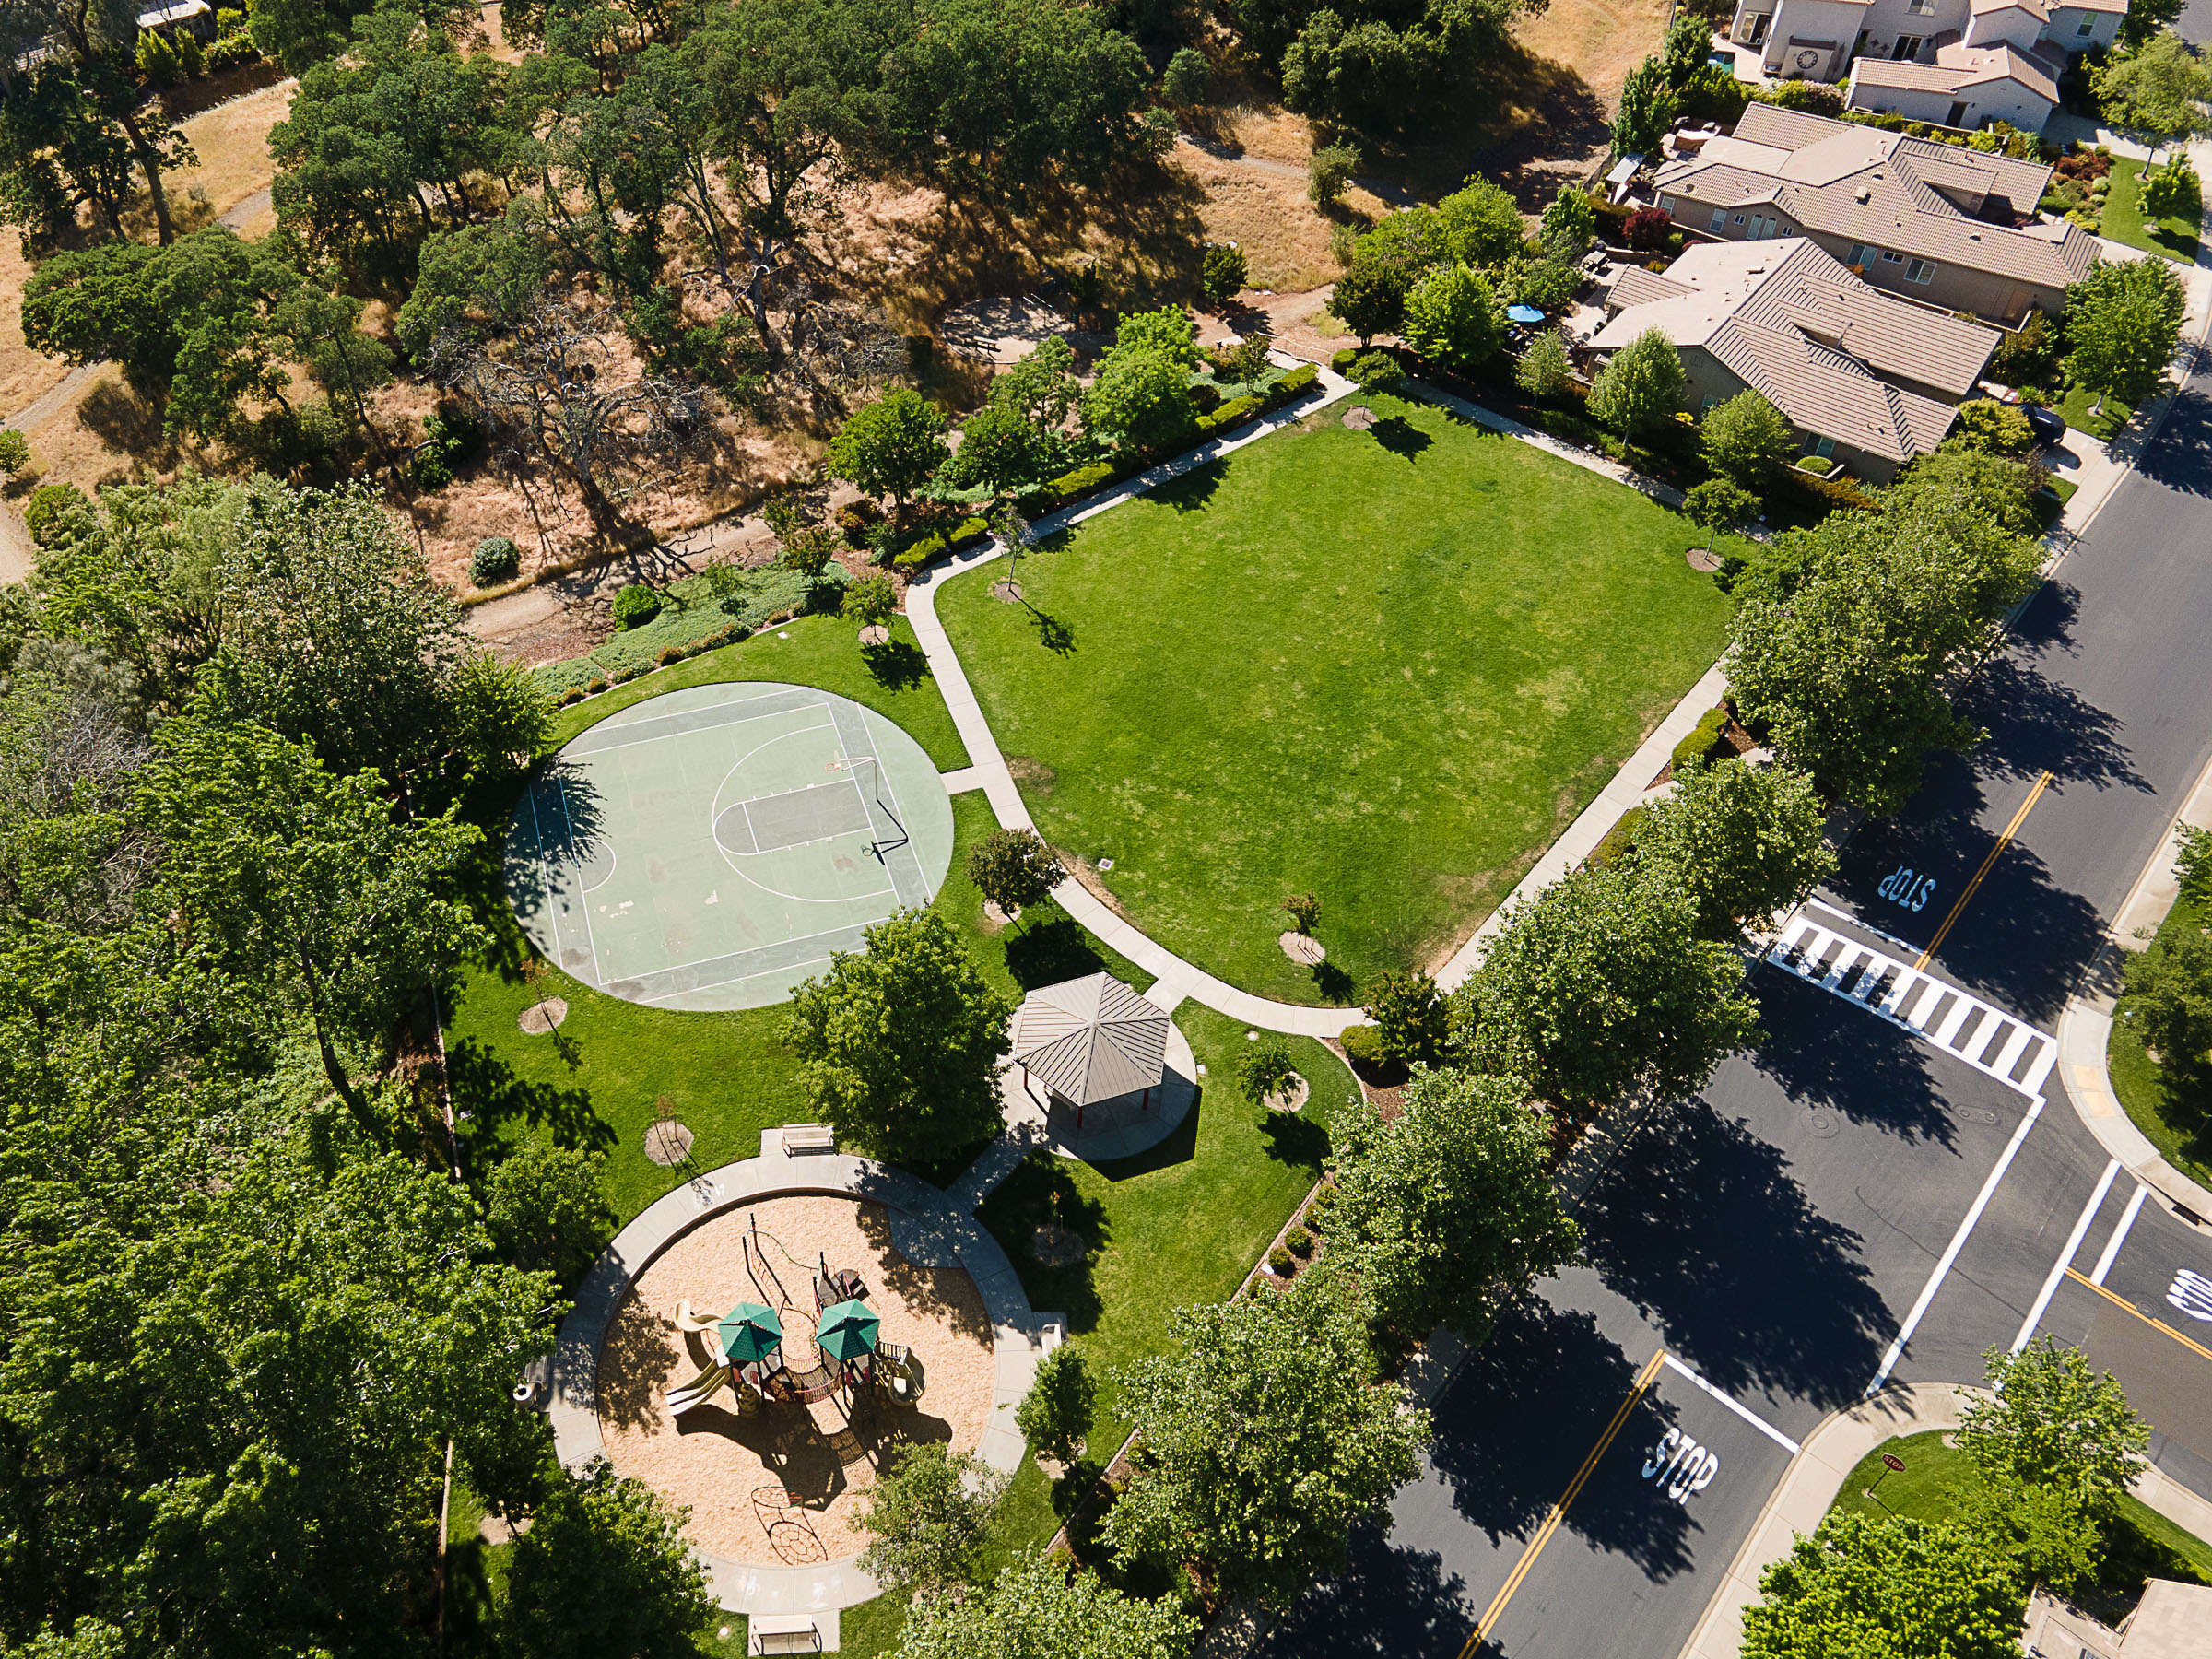
Serrano Real Estate in 2026: Two Markets Under One Roof

Serrano doesn't have one real estate market right now. It has two.
Under $2 million, inventory is tight at 2.3 months of supply, 35% of listings are under contract, and homes are selling at 98.2% of list price. Above $2 million, months of supply jumps to 6.5, the pending ratio drops to 7%, and active listings are sitting an average of 59 days without a single offer in several price brackets.
Same gates. Same amenities. Same country club. Completely different market dynamics depending on which side of that $2M line your home falls on.
We've tracked Serrano's market data monthly since 2019, and this split isn't new — but it's as wide as we've seen it. If you're buying or selling in Serrano right now, the price range matters more than the neighborhood name.
See where your Serrano home falls — request a pricing analysis.
The Under-$2M Market: Competitive and Moving
As of February 8, 2026, Serrano has 26 active listings priced below $2 million, with 9 pending sales — a 35% pending ratio. Months of supply sits at 2.3. Homes in this range are selling at 98.2% of list price with an average of 44 days on market.
But the real story is in the price bands within that range.
$750K–$1M is the entry point for Serrano and it's active. Eight homes are listed, four are pending — a 50% pending ratio. Months of supply is 1.9. Homes are selling at 99% of list price. If you're priced right in this band, buyers are competing for your home.
$1M–$1.25M is the tightest band in all of Serrano. Six active listings against one pending might look slow on the surface, but 26 homes sold in this range over the past six months at an average of just 33 days on market. That's a pace of 4.3 sales per month, putting months of supply at 1.4. Homes that are priced within the demand band are moving.
$1.25M–$1.5M is where sellers have the most leverage right now. Six active, four pending — a 67% pending ratio, the highest in the entire Serrano market. Homes in this band are selling at 100.2% of list price. That's above asking. If your home profiles into this range, this is as favorable as the data gets.
$1.5M–$1.75M is where the shift begins. Four active listings, zero pending. Average days on market for active listings is 113 days. Homes that sold in this range over the past six months took 61 days and sold at 95.1% of list. This band is where buyer engagement drops meaningfully.
$1.75M–$2M reinforces the pattern. Two active listings averaging 411 days on market. Zero pending. Three sold in six months at 96.5% of list. The demand is thin.
The takeaway for the under-$2M market: the sweet spot is $750K–$1.5M, with the strongest conditions in the $1.25M–$1.5M band. Above $1.5M, sellers need to price precisely to attract the shrinking pool of active buyers.
The $2M+ Market: A Different Conversation
Cross the $2 million threshold in Serrano and the data changes dramatically.
There are 15 active listings above $2M. One is pending. That's a 7% pending ratio — compared to 35% below $2M. Months of supply is 6.5, which puts this firmly in buyer's market territory.
Here's how it breaks down:
$2M–$2.5M has some activity. Four active listings, zero pending, but eight homes sold in the past six months at an average of 29 days on market and 96.4% of list. The pace is slow but transactions are happening when priced correctly.
$2.5M–$3M is thin in every direction. Zero active, one pending, one sold in six months. Not enough data to draw conclusions — but the low volume itself tells you demand is sparse.
$3M–$3.5M has five active listings, zero pending. Two sold in six months at 56 days on market. Months of supply is 16.7 — over a year of inventory at the current pace. Sellers in this band need patience and precise pricing.
$3.5M–$4M is similar. Five active, zero pending, three sold in six months at 65 days on market and 96.7% of list. Months of supply is 10.
The overall $2M–$5M segment in Serrano shows homes selling at 97.3% of list with an average of 40 days on market when they do sell. But the pending ratio of 7% tells you that most of the active inventory isn't attracting offers. The gap between what sellers are asking and what buyers are willing to pay is wider up here — average active price is $1,981,528 while the average sold price is $1,358,104 across all of Serrano. That spread reflects the concentration of overpriced luxury inventory pulling the active average upward.
What's Driving the Split
Three forces are creating this two-market dynamic.
Buyer depth drops off above $1.5M. The pool of buyers who can qualify for and are actively shopping above $2M in Serrano is significantly smaller than the pool under $1.25M. Interest rates in the high-6% to 7% range compress purchasing power, and fewer buyers at higher price points means less competition and longer timelines.
Sellers above $2M are pricing to aspirations, not demand. The pricing analysis data shows that Serrano Country Club homes — which account for much of the $2M+ inventory — originally listed at an average of $2,022,216 and sold for $1,948,391. That's a 3.7% gap. But the average active price of $2,548,670 suggests current listings are priced well above where recent transactions have closed. Until active prices align with closed prices, these listings will sit.
The under-$1.5M market benefits from Sacramento metro demand. Serrano's entry-level and mid-range homes draw from a regional buyer pool — Bay Area relocators, move-up buyers from Sacramento and Folsom, and families attracted to the schools and lifestyle. That broader demand base keeps velocity high and supply low in the lower bands.
What This Means If You're Selling in Serrano
If your home is priced between $750K and $1.5M, you're in a favorable position. The data supports pricing confidently within your demand band and expecting competitive activity — especially in the $1.25M–$1.5M range where the pending ratio is 67% and homes are selling above asking.
If your home is in the $1.5M–$2M range, you're in a transitional zone. Deals are getting done, but only for homes priced accurately. Days on market are longer and every dollar of overpricing costs you disproportionately. This is where the quality of your pricing strategy matters most.
If your home is above $2M, you're in a buyer's market and need to plan accordingly. That means pricing at or slightly below recent closed comparables — not above them — and preparing for a longer timeline. The homes that are selling in this range are the ones priced to where demand actually exists, not where sellers wish it existed.
The Takeaway
Serrano is one of the most desirable communities in the Sacramento region. That hasn't changed. What has changed is that buyer behavior is concentrated in specific price bands — and the $2M line is the clearest dividing point in the current data.
Whether you're buying or selling, the starting point is knowing exactly which market you're in. Not the Serrano market. Your demand band within it.
Curious which side of the split your home falls on? Request a pricing analysis and we'll show you the demand band data specific to your home's profile and price range.
Data source: AreaPro Market Reports as of February 8, 2026. Current metrics (active, pending, months of supply, pending ratio) are point-in-time. Performance metrics (sold price, DOM, sold-to-list ratios) represent the trailing 6-month period (August 2025 – February 2026). Analysis by Shannon Yoffie, Yoffie Real Estate Group.
Related: El Dorado Hills Market Report | El Dorado Hills Home Prices in 2026 | The $25K Mistake: Demand Band Pricing
|


or another way