
Categories
Market UpdatesData Deep-Dive
The Pricing Gap El Dorado Hills
Sellers Can't Ignore in 2026
By Shannon & Jon Yoffie | February 18, 2026 | 7-minute read
The average active listing price in El Dorado Hills in 2025 ranged from $1.2 million to $1.68 million. The average sold price during the same period came in at $967,000 to $1.23 million. That is a gap of $200,000 to $450,000 between what sellers are asking and what buyers are actually paying — the widest disconnect we have measured in seven years of monthly MLS tracking.
This isn't a stat buried in a spreadsheet. It's the single most important number in the El Dorado Hills housing market right now, and it affects every seller, every buyer, and every agent working in this community.
What the Data Actually Shows
To understand how unusual this gap is, you need context. We've tracked average active price versus average sold price in El Dorado Hills every month since January 2019. Here is what that history looks like:
| Period | Avg. Active Price | Avg. Sold Price | Gap |
|---|---|---|---|
| 2019 (avg) | $955K | $769K | ~$186K |
| Mid-2021 (peak frenzy) | $1,468K | $1,006K | ~$462K* |
| 2022 (correction) | $1,433K | $1,039K | ~$394K |
| 2024 (avg) | $1,350K | $1,076K | ~$274K |
| Mid-2025 - Now | $1,307K–$1,682K | $967K–$1,229K | $200K–$450K+ |
*In mid-2021, the gap was large in dollar terms but the sold-to-list ratio was 103–105%, meaning buyers were paying above asking. The gap reflected high-end active inventory, not overpricing. Today's gap is different — it reflects actual seller overpricing.
The critical difference between the 2021 gap and the 2025–2026 gap is the sold-to-list ratio. In 2021, that ratio was 103–105% — homes were flying off the shelf above asking. Today, it sits at 97–99%. Buyers aren't chasing. They're calculating. And the data says a significant portion of active inventory is priced above what the market will bear.
Why This Gap Exists Right Now
Three forces are converging to create this disconnect:
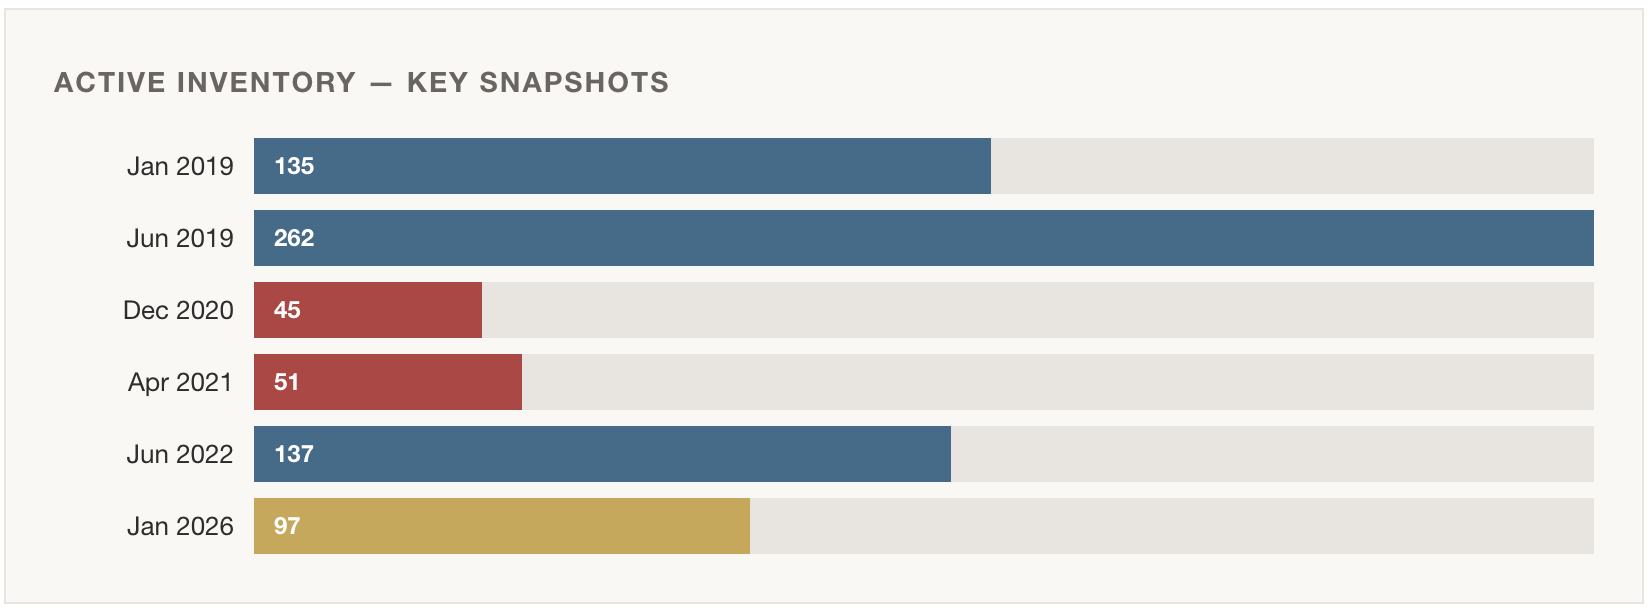
1. Anchoring to peak values. Many El Dorado Hills homeowners watched their neighbor's house sell for $1.1 million or more in 2021–2022 and anchored to that number. But that peak represented a specific moment — historically low inventory (as few as 45 active homes in December 2020), pandemic-era demand, and sub-3% interest rates. Those conditions no longer exist.
2. Inventory is rising. New listings surged 30–45% year-over-year in the spring and summer of 2025, with 128 new listings in June 2025 alone versus 107 the prior June. More choices for buyers means less urgency and more negotiating power.
3. Rate-locked homeowners are finally moving. After years of being "rate-locked" — unwilling to sell and give up a sub-4% mortgage — some homeowners are entering the market driven by life events (retirement, job changes, upsizing, downsizing). But many are pricing based on what their home was worth two years ago, not what it is worth today.
"The gap between asking and selling prices in El Dorado Hills has never been wider. Hope is not a pricing strategy — data is."
What Overpricing Actually Costs You
Overpricing doesn't just mean your home sits longer. It means your home sells for less than if you had priced it correctly from the start. The data makes this clear:
The sold-to-list ratio (what buyers pay vs. the most recent asking price) sits at 97–99%. That's close to asking. But the sold-to-original-list ratio — what buyers pay vs. where the home was first listed — drops to 94–96% throughout much of 2024–2025. That 3–5% difference on a million-dollar home is $30,000 to $50,000 left on the table, plus months of carrying costs, stress, and a stale listing stigma.
Meanwhile, cumulative days on market — which tracks how long a home has been exposed to the market including relists — hit 124 days in January 2026. One year ago, it was 58 days. That spike tells us homes are being pulled off the market, relisted (sometimes with a new agent), and still not selling. The "relist and pray" strategy is not working.
The Real Cost of Overpricing a $1M EDH Home
| Priced right from day one | Sells at ~$985K–$990K |
| Listed at $1.1M, reduced, sells after 90+ days | Sells at ~$940K–$960K |
| Difference (lost equity + carrying costs) | $30K–$50K+ lost |
What Smart Sellers in El Dorado Hills Are Doing Instead
The homes that are selling efficiently in this market share common traits. They are priced within 2% of recent comparable sales. They show well. And they hit the market with a strategy, not a guess.
The sold-to-list ratio of 98–99% tells us the market will meet a fair price. Buyers are not trying to lowball — they are simply refusing to overpay. There is a meaningful difference between those two things, and the best agents understand it.
Pricing right the first time also matters more in a market where new listings are surging. With 30–45% more new listings hitting the market in 2025 versus 2024, every week your home sits is a week where new, better-priced competition appears. The first two weeks of a listing's life generate the most buyer interest. Miss that window and you are fighting an uphill battle.
If You're a Buyer: How to Use This Data
The pricing gap is leverage — if you know how to use it. Here's what the data tells buyers right now:
Homes that have been on the market for 45+ days are the strongest negotiation targets. If a home has had one or more price reductions, the seller is already adjusting to reality. Use the sold-to-original-list ratio (94–96%) as your benchmark, not the most recent asking price.
That said, do not expect deep discounts on well-priced homes. The 98–99% sold-to-list ratio means correctly priced inventory still commands near-asking offers. The bargains are in the overpriced, stale listings — not across the board.
Want the Full Picture?
This analysis is one piece of our comprehensive monthly market report covering every metric in El Dorado Hills since 2019.
Read the Full El Dorado Hills Market Report →Frequently Asked Questions
Are El Dorado Hills homes overpriced in 2026?
Many are, yes. The average active listing price ranges from $1.2 million to $1.68 million, while the average sold price comes in at $967,000 to $1.23 million. That gap of $200,000 to $450,000 between asking and selling prices is the widest we have measured in seven years of monthly MLS tracking.
How much below asking price are El Dorado Hills homes selling for?
On average, homes sell at 97–99% of their most recent list price. However, homes that were originally overpriced and later reduced are selling at 94–96% of their original list price. That difference on a $1 million home means $30,000 to $50,000 lost, plus months of carrying costs.
What happens if I overprice my El Dorado Hills home?
Overpriced homes sit significantly longer. Cumulative days on market hit 124 days in January 2026, more than double the prior January. Homes requiring price reductions typically sell at 94–96% of their original list price, compared to 98–99% for correctly priced homes. Overpricing costs both time and money.
How should I price my El Dorado Hills home in 2026?
Price within 2% of recent comparable sold prices in your specific neighborhood. The 98–99% sold-to-list ratio confirms the market will meet a fair price but will not chase an aspirational one. A data-driven comparative market analysis using hyperlocal sold data is essential. Contact us for a free pricing consultation backed by seven years of monthly market data.
Is El Dorado Hills still a seller's market?
Not exactly. With months of inventory ranging from 2.1 to 4.4 months throughout 2025, El Dorado Hills is in a transitional market. Sellers who price accurately still transact efficiently, but overpriced sellers are being punished more severely than at any point since 2019. It is a market where strategy and data determine outcomes more than market momentum. For a full breakdown, see our Monthly Market Report.
Thinking About Selling in El Dorado Hills?
Get a pricing strategy backed by 7 years of monthly data — not guesswork. We'll show you exactly where your home fits in today's market.
Get Your Free Pricing AnalysisShannon & Jon Yoffie | Yoffie Real Estate Group
Keller Williams El Dorado Hills | (916) 941-6566
Data source: MetroList MLS, tracked monthly since January 2019 by Yoffie Real Estate Group. This article is for informational purposes only and does not constitute financial or legal advice.


