
Categories
AdvisoryPublished October 6, 2026
Selling in El Dorado Hills in October vs. May: what the 2026 numbers show

Selling in El Dorado Hills in October vs. May: what the 2026 numbers show
By Jon Yoffie, Co-Founder, Yoffie Real Estate Group | DRE# 02030510 | Last updated October 9, 2026
Quick answer
- From 2019 to 2025, October closings averaged 35 days on market vs. 23 for May.
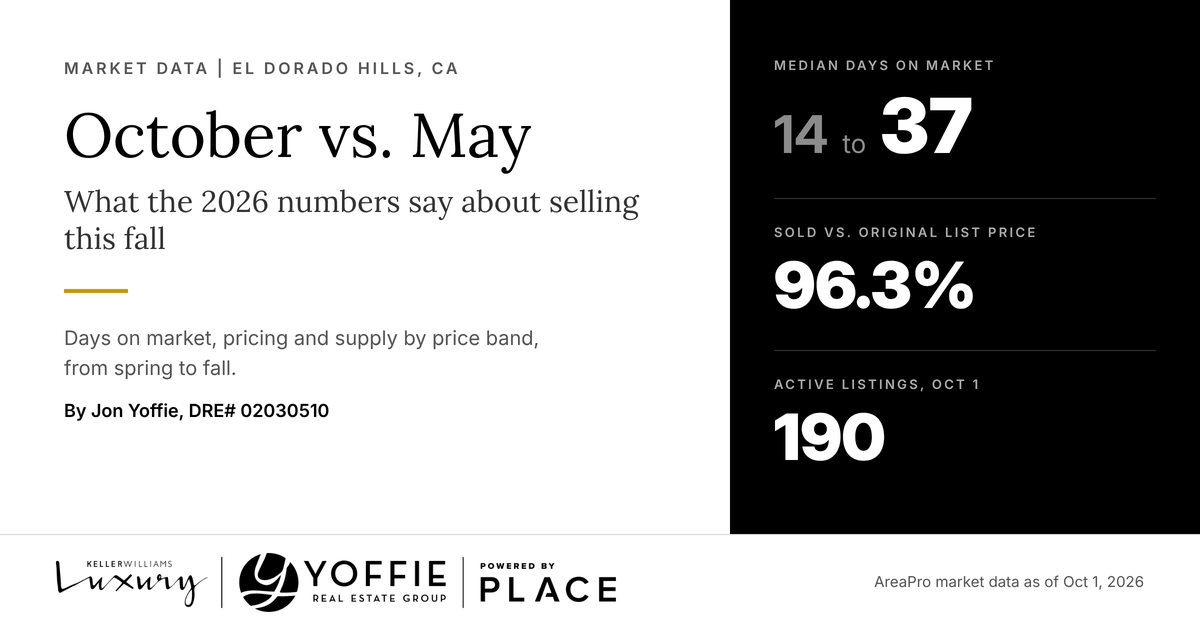
- Median days on market for sold homes rose from about 14 in late spring to about 37 by Oct 1, 2026.
- Sellers averaged 98.5% of final list price but 96.3% of original list price.
- Under $1.25 million, supply is 2.2 to 2.4 months.
Selling a home in El Dorado Hills in October takes more patience than selling in May, and the first list price matters more than the season. According to our analysis of AreaPro market data as of Oct 1, 2026, the median sold home now spends about 37 days on market, up from about 14 in late spring. Buyers have more homes to choose from and more time to decide.
Fall rewards sellers who price to the buyers in front of them this month. If you want to see where your home sits against what's closing now, request a Smart Pricing Analysis and we'll run it with the same data.
At Yoffie Real Estate Group, we have been tracking El Dorado Hills, CA sales in a proprietary MLS database since January 2019, from Serrano to Blackstone, a few minutes from El Dorado Hills Town Center. Here's how this fall compares with this spring.
How much longer do El Dorado Hills homes take to sell in October?
In a typical year, about 50% longer: across 2019 to 2025, El Dorado Hills homes that closed in October averaged 35 days on market, compared with 23 for May closings.
That pattern held in all 7 years of our Yoffie Real Estate Group MLS database, and 2026 is running wider than usual. Median days on market for sold homes went from about 14 in late spring to about 37 at Oct 1, 2026, based on AreaPro's monthly charts, which are approximate. Homes still on the market have been listed an average of 65 days.
An October listing in El Dorado Hills should plan on roughly 5 weeks to sell, where a late-spring listing often sold in about 2.
October buyers have more choices and more time
Active listings in El Dorado Hills reached 190 on Oct 1, 2026, up from 171 on April 8. Pending sales moved the other way, from 62 to 56, which pulled the pending ratio down from 36% to 29%.
Closings followed. Monthly sales peaked near 80 in August and slipped to about 58 in September, again reading from the AreaPro charts. Months of supply sits at 2.9, measured against the summer's faster sales pace, so it will likely drift higher as September's slower month works into the trailing numbers.
Fall buyers in El Dorado Hills are selective, and they have the inventory to be. For the spring baseline, see our September 2026 El Dorado Hills market report.
The first list price matters more in fall
El Dorado Hills sellers who closed between Jul 2 and Oct 1, 2026 got 98.5% of their final list price on average, but only 96.3% of their original list price.
The difference between those two numbers is mostly price reductions made before an offer arrived. On a home first listed at $1 million, a 3.7-point gap is about $37,000.
That gap is what the Smart Seller Pricing System is built to close. We set the first price from what's closing in your price band now, so a reduction doesn't have to do the work later.
|
"In a slower fall market, the most expensive mistake is a list price set for last spring's buyers." Jon Yoffie, DRE# 02030510 |
Price band decides how much the season matters
Under $1.25 million, El Dorado Hills is still a tight market, with 2.2 to 2.4 months of supply and homes selling at 98.6% to 99.0% of list.
| Price band | Active | Pending ratio | Sold (3 mo) | Days on market (sold) | % of list | Months of supply |
|---|---|---|---|---|---|---|
| $0 - $750K | 35 | 40% | 44 | 47 | 98.6% | 2.4 |
| $750K - $1M | 53 | 34% | 67 | 41 | 99.0% | 2.4 |
| $1M - $1.25M | 26 | 31% | 36 | 42 | 98.7% | 2.2 |
| $1.25M - $1.5M | 17 | 29% | 15 | 30 | 98.7% | 3.4 |
| $1.5M - $1.75M | 16 | 13% | 14 | 32 | 97.9% | 3.4 |
| $1.75M - $2M | 8 | 38% | 7 | 55 | 96.9% | 3.5 |
| $2M - $5M | 31 | 19% | 16 | 61 | 97.3% | 5.8 |
| $5M+ | 4 | 0% | 0 | n/a | n/a | n/a |
Source: AreaPro (REMO) market data for El Dorado Hills as of Oct 1, 2026. Sold, days on market and % of list cover Jul 2 to Oct 1, 2026. The $2M - $5M row is AreaPro's segment total.
The $750,000 to $1 million band is the busiest in town, with 67 sales in 3 months at 99.0% of list. Above $1.5 million the picture changes. The $1.5 million to $1.75 million band has a 13% pending ratio, and the $2 million to $5 million segment carries 5.8 months of supply, though that's down from 13.6 in April.
Neighborhood matters inside those bands. AreaPro's weekly summary dated Oct 5, 2026 showed Serrano at 77 active listings and 4.5 months of supply, while Blackstone had 16 actives and 2.9 months.
Season matters least where supply is tightest, which in El Dorado Hills this fall means under $1.25 million.
Listing now or waiting for spring
If your El Dorado Hills home is under $1.25 million and you plan to move within 6 months, the October numbers support listing now at a price set for fall buyers.
Spring 2026 brought faster sales, and price has moved two ways since. The median sold price rose from $877,000 for May closings to $930,000 for August, while price per square foot slipped from $408 to $382. Buyers are paying more in total for larger homes and less for each square foot.
Seven years of closings show the same pattern. Across 2019 to 2025, El Dorado Hills homes that closed in October sold for 97.0% of their original list price on average, against 99.6% for May closings, and October came in lower in 6 of those 7 years. Price per square foot averaged $331 for October closings and $344 for May, about 4% less.
| 7-year average, 2019-2025 | May closings | October closings |
|---|---|---|
| Average days on market | 23 | 35 |
| Average cumulative days on market | 28 | 43 |
| Sold price vs. original list | 99.6% | 97.0% |
| Median sold price | $913K | $879K |
| Price per square foot | $344 | $331 |
| Closed sales per month | 72 | 59 |
Source: Yoffie Real Estate Group MLS database, El Dorado Hills monthly closed sales, January 2019 to August 2026. Median sold price is the average of each year's monthly median.
Above $1.5 million, where pending ratios are lower and supply runs 3.4 months or more, the right call depends on how far your price expectation sits from recent closings. If you're also weighing tax timing, read what changes if you sell in El Dorado Hills before December 31.
We'll refresh these El Dorado Hills numbers after the next MLS release in early November. Between reports, our live El Dorado Hills market data page tracks the same measures.
|
See where your home sits this fall We'll compare your home with what's closing in your price band and neighborhood right now.
|
Frequently asked questions
Is fall a bad time to list a home in El Dorado Hills?
Fall is slower, and well-priced homes still sell close to asking. Over the 3 months ending Oct 1, 2026, El Dorado Hills sellers averaged 98.5% of their final list price, and homes under $1.25 million sold at 98.6% to 99.0% of list, according to AreaPro market data. The tradeoff is time: median days on market for sold homes is about 37, up from about 14 in late spring.
How much longer do homes take to sell in October than in May in El Dorado Hills?
In a typical year, about 50% longer. Across 2019 to 2025, El Dorado Hills homes that closed in October averaged 35 days on market, compared with 23 for May closings, according to Yoffie Real Estate Group's MLS data. The gap is wider in 2026: median days on market for sold homes rose from about 14 in late spring to about 37 by Oct 1, based on AreaPro market data.
Do fall listings sell for less in El Dorado Hills?
Modestly, yes. Across 2019 to 2025, El Dorado Hills homes that closed in October averaged $331 per square foot, about 4% below the $344 average for May closings, and sold for 97.0% of their original list price against 99.6% in May, according to Yoffie Real Estate Group's MLS data. Most of that gap comes from price reductions, so a first list price set to fall closings protects the most money.
Should I sell my El Dorado Hills home now or wait until spring?
If your El Dorado Hills home is under $1.25 million and you plan to move within 6 months, the October data supports listing now at a price set for fall buyers. That range has 2.2 to 2.4 months of supply and is selling at 98.6% to 99.0% of list. Above $1.5 million, supply runs 3.4 months or more, so the answer depends on how close your price expectation sits to recent closings.
Did I miss the peak to sell my El Dorado Hills home?
On total price, 2026 has held up so far. In Yoffie Real Estate Group's MLS data, the median sold price in El Dorado Hills was $877,000 for May 2026 closings and $930,000 for August, though price per square foot slipped from $408 to $382. What sellers gave up after spring was speed. A fall listing should plan on about 5 weeks on market instead of about 2.
Which price ranges are selling fastest in El Dorado Hills right now?
Among El Dorado Hills price bands with 10 or more sales in the 3 months ending Oct 1, 2026, homes from $1.25 million to $1.75 million sold fastest, at 30 to 32 days on market. The busiest band was $750,000 to $1 million, with 67 sales at 99.0% of list. The $1.75 million to $2 million band was slower, at 55 days and 96.9% of list, according to AreaPro market data.
Sources and methodology
Market figures come from AreaPro (REMO) market data for El Dorado Hills as of Oct 1, 2026. Sold figures cover the trailing 3 months (Jul 2 to Oct 1, 2026). April figures come from the Apr 8, 2026 report, which used a 6-month window, so this post compares rates and ratios rather than raw sales counts. Monthly trends (median sold price, monthly sales, days on market by month) are read from AreaPro charts and are approximate. Seven-year May and October comparisons and the 2026 monthly figures come from Yoffie Real Estate Group's MLS database for El Dorado Hills (monthly closed sales, January 2019 to August 2026), averaged across 2019 to 2025. Serrano and Blackstone figures come from the AreaPro weekly REMO summary dated Oct 5, 2026. Figures are not adjusted for home size or the mix of homes sold. Analysis by Yoffie Real Estate Group.
|
About the author. Jon Yoffie is Co-Founder and Luxury Real Estate Advisor at Yoffie Real Estate Group, PLACE / Keller Williams, CA DRE# 02030510. He has tracked El Dorado Hills MLS data in his own database since January 2019 and writes the team's monthly market reports and seller strategy research. Yoffie Real Estate Group is RealTrends Verified 2026 as a Top 5 Small Team for El Dorado Hills and Folsom. Jon advises sellers across El Dorado Hills, Folsom, Cameron Park, and Truckee/North Lake Tahoe using the Smart Seller Pricing System. Meet Jon and Shannon Yoffie. |

Shannon and Jon Yoffie
Co-Founders | Yoffie Real Estate Group | Keller Williams
or another way