
Categories
AdvisoryPublished June 25, 2026
Moving to El Dorado Hills from Bay Area 2026
Moving to El Dorado Hills from the Bay Area: What the Data Actually Shows in 2026
Santa Clara County's median single-family home closed at $2,050,000 in May 2026. El Dorado Hills averaged $1,080,139 at close over the same general period.
Bay Area buyers tend to read that gap as confirmation that El Dorado Hills is affordable. A few read it as a step down. The market data doesn't support either read.
At a $1.5M budget, you're below the county median in San Jose, the most accessible city in Santa Clara County. That same $1.5M in El Dorado Hills puts you in the hottest demand segment of a market where inventory under $1.75M is tight, sellers are getting close to full price, and homes move in under 30 days.
Realtor.com's 7 Levels of Luxury report, out June 25, 2026, frames it nationally: $1.28M is the 90th percentile price point across the country. That's the definition of luxury by their measure. In Santa Clara County, $1.28M sits below the county median. In El Dorado Hills, it puts you in the upper range of the market's most active price band.
Here's how the comparison plays out, band by band.
What Does $1.28 Million Buy? It Depends Where You Are
In Palo Alto, $1.28M doesn't get you in the door. The median SFR there closed at $4.2M in May 2026 at 108% of list. Even in San Jose, the most accessible market in Santa Clara County, $1.28M puts you nearly $400,000 below the city's $1,652,500 median.
In El Dorado Hills, $1.28M puts you at the top of the $1M-$1.25M price band, where homes closed at 98.5% of list with a 34% pending ratio over the past three months. By every national benchmark, that's a luxury purchase. By Bay Area standards, it's a budget that barely registers.
We work with buyers coming from the Bay who expect El Dorado Hills to feel like a relief from competitive markets. The under-$1.5M segment isn't that. It's competitive in the ways that matter. What's different is the transaction itself. Financing works. Inspections happen. You're not writing offers at 108% of ask with every contingency stripped out just to lose to an all-cash buyer.
The Santa Clara County Numbers (May 2026)
According to the Santa Clara County Association of Realtors' May 2026 statistics report, the county median for single-family homes was $2,050,000. The county average was $2,585,767. Homes sold in 19 days at $1,148 per square foot and 104% of list price.
Run the math on that 104% figure. On a $2.05M median home, the over-ask premium adds roughly $82,000 to the purchase price. That money has to come from cash reserves, because it can't be rolled into the loan. For a buyer putting 20% down, the financed amount stays the same. The premium is just gone from your account.
The city-level breakdown shows how far it extends:
| City | Median Sale Price (SFR) | Avg Days on Market | % of List Price |
|---|---|---|---|
| Los Altos | $4,564,000 | 22 days | 107% |
| Palo Alto | $4,200,000 | 19 days | 108% |
| Cupertino | $3,550,000 | 14 days | 105% |
| Sunnyvale | $2,775,000 | 13 days | 107% |
| Mountain View | $2,899,000 | 12 days | 107% |
| Santa Clara (city) | $1,900,000 | 13 days | 105% |
| San Jose | $1,652,500 | 20 days | 104% |
| Santa Clara County SFR (Overall) | $2,050,000 | 19 days | 104% |
Source: Santa Clara County Association of Realtors (SCCAOR), May 2026 SFR statistics.
San Jose at $1,652,500 is the most accessible entry point in the county. At 104% of list, the actual purchase price on a median San Jose home runs closer to $1,718,600. A buyer with a $1.5M budget is shopping below that.
How El Dorado Hills Breaks Down by Price Range
As of June 24, 2026, El Dorado Hills, CA 95762 has 199 active listings, 83 pending contracts, and a 42% pending ratio across the full market. Overall supply is 2.8 months. Homes that sold over the trailing three months (March 25 through June 24, 2026) averaged 33 days on market at 98.9% of list.
The full-market numbers flatten a two-speed market. Below $1.75M, EDH favors sellers. Above $2M, it shifts the other direction, and shifts meaningfully.
| Price Range | Active Listings | Pending Ratio | Months of Supply | % of List Price (Sold) | Avg DOM (Sold) |
|---|---|---|---|---|---|
| $750K-$1M | 52 | 58% | 2.1 months | 99.5% | 31 days |
| $1M-$1.25M | 29 | 34% | 3.8 months | 98.5% | 32 days |
| $1.25M-$1.5M | 21 | 38% | 2.3 months | 99.6% | 28 days |
| $1.5M-$1.75M | 8 | 50% | 2.7 months | 100.3% | 104 days* |
| $1.75M-$2M | 12 | 25% | 12.0 months | 99.4% | 17 days |
| $2M-$5M | 39 | 13% | 7.4 months | 95.4% | 20 days |
| $5M+ | 3 | 0% | N/A | N/A | 238 days avg active |
Source: AreaPro Market Reports as of June 24, 2026. Active listings, pending ratios, and months of supply are point-in-time. DOM and % of list price represent the trailing 3-month period, March 25 - June 24, 2026.
*The $1.5M-$1.75M band had only 9 sold homes in the trailing period. That 104-day average DOM reflects extended timelines on a small sample, but 100.3% of list confirms that sellers here held firm until they got their price.
The $1.5M-$1.75M band is easy to overlook because there's so little of it: 8 active listings, 4 already under contract. A 50% pending ratio with homes closing above ask tells you buyers in this range are competing, even when inventory is thin.
Is El Dorado Hills More Competitive Than Buyers Expect?
For buyers under $1.75M, yes. El Dorado Hills has 2.4 months of supply below $2M as of June 24, 2026, with a 50% pending ratio across that segment. Pending ratios in the strongest price bands run 50-58%. Well-priced homes are moving in 28-31 days.
The difference is how competition plays out here versus the Bay Area. We haven't seen the waived-contingency, all-cash free-for-all in El Dorado Hills that buyers from Cupertino or Mountain View deal with as a baseline. A pre-approved buyer who moves within a few days of a well-priced listing going active can compete on standard terms. In most Bay Area markets right now, that's not realistic at comparable budgets.
The $750K-$1M band is the tightest in the market: 2.1 months of supply and a 58% pending ratio. Homes close at 99.5% of list. Even at that level, financing works. But you need to be ready. The buyers who get into EDH in this price range are making decisions in days, not weeks.
Above $1.25M, conditions ease somewhat. The $1.25M-$1.5M band has 2.3 months of supply and 99.6% of list. Well-positioned buyers can be decisive without being panicked. That's a meaningful difference from writing a seventh offer in San Jose.
Where Bay Area Buyers Have Real Negotiating Room in El Dorado Hills
The $2M+ segment is a buyer's market. As of June 24, 2026, the $2M-$5M range has 7.4 months of supply and a 13% pending ratio. Only 16 homes sold at this level over the past three months.
At 95.4% of list, sellers in that range are closing $80,000 to $140,000 below asking on average. On a $3M listing, the average buyer closed at roughly $2,862,000. With 7.4 months of supply and only 16 sales in 90 days, sellers here are competing for the buyers who show up.
The $3M-$3.5M band specifically: 11 active listings, 1 pending, roughly 15 months of supply, with recent closings at or below 90% of list. A buyer with a $3M budget who's been writing offers at 107% of ask in Santa Clara County will find a genuinely different dynamic in this segment.
At comparable price points across the Bay, you're writing against cash buyers who've stripped every contingency. In the EDH $2M-$5M segment, you can inspect, negotiate, and take a beat before deciding. Active listings here have averaged 90+ days on market without going under contract. Sellers who priced to the 2024 peak are adjusting. Patient buyers have room that Bay Area markets at these price points simply don't offer.
What 104% vs. 98.9% Actually Costs
The over-ask premium in Santa Clara County is real money, and it's not financeable. At the county SFR median of $2,050,000, a buyer paying 104% of list closes at $2,132,000. The $82,000 premium comes from cash. It sits outside the loan, earns no mortgage interest deduction, and reduces the reserves you walk into the home with.
In El Dorado Hills, buyers closed at 98.9% of list over the trailing three months. On a $1.5M purchase, that's approximately $1,483,500 at close, about $16,500 below asking. The buyer coming from the Bay Area knows how to write aggressive offers. The EDH market under $2M doesn't require it. Be ready to move, but you're not automatically in a bidding war.
Here's the practical side of that gap. A Bay Area buyer with a $2M budget and an EDH buyer with a $1.5M budget are $500,000 apart on paper. But the Bay Area buyer is also writing in over-ask cash well above the purchase price, likely in a faster transaction with compressed or waived contingencies. The EDH buyer is closing at or below list with standard terms. At similar monthly payments after factoring in down payment and financing, the two buyers' actual purchase experiences look very different.
Realtor.com's 7 Levels of Luxury framework makes this structural: supply-constrained markets like Santa Clara County build the over-ask premium into the transaction as a baseline cost. EDH sits at the national luxury threshold without that premium, at least below $1.75M.
Current Listings for Comparison
What These Numbers Look Like in Real Life
The market data above is more useful when you can see what it buys. These four El Dorado Hills listings span the price bands discussed in this report.
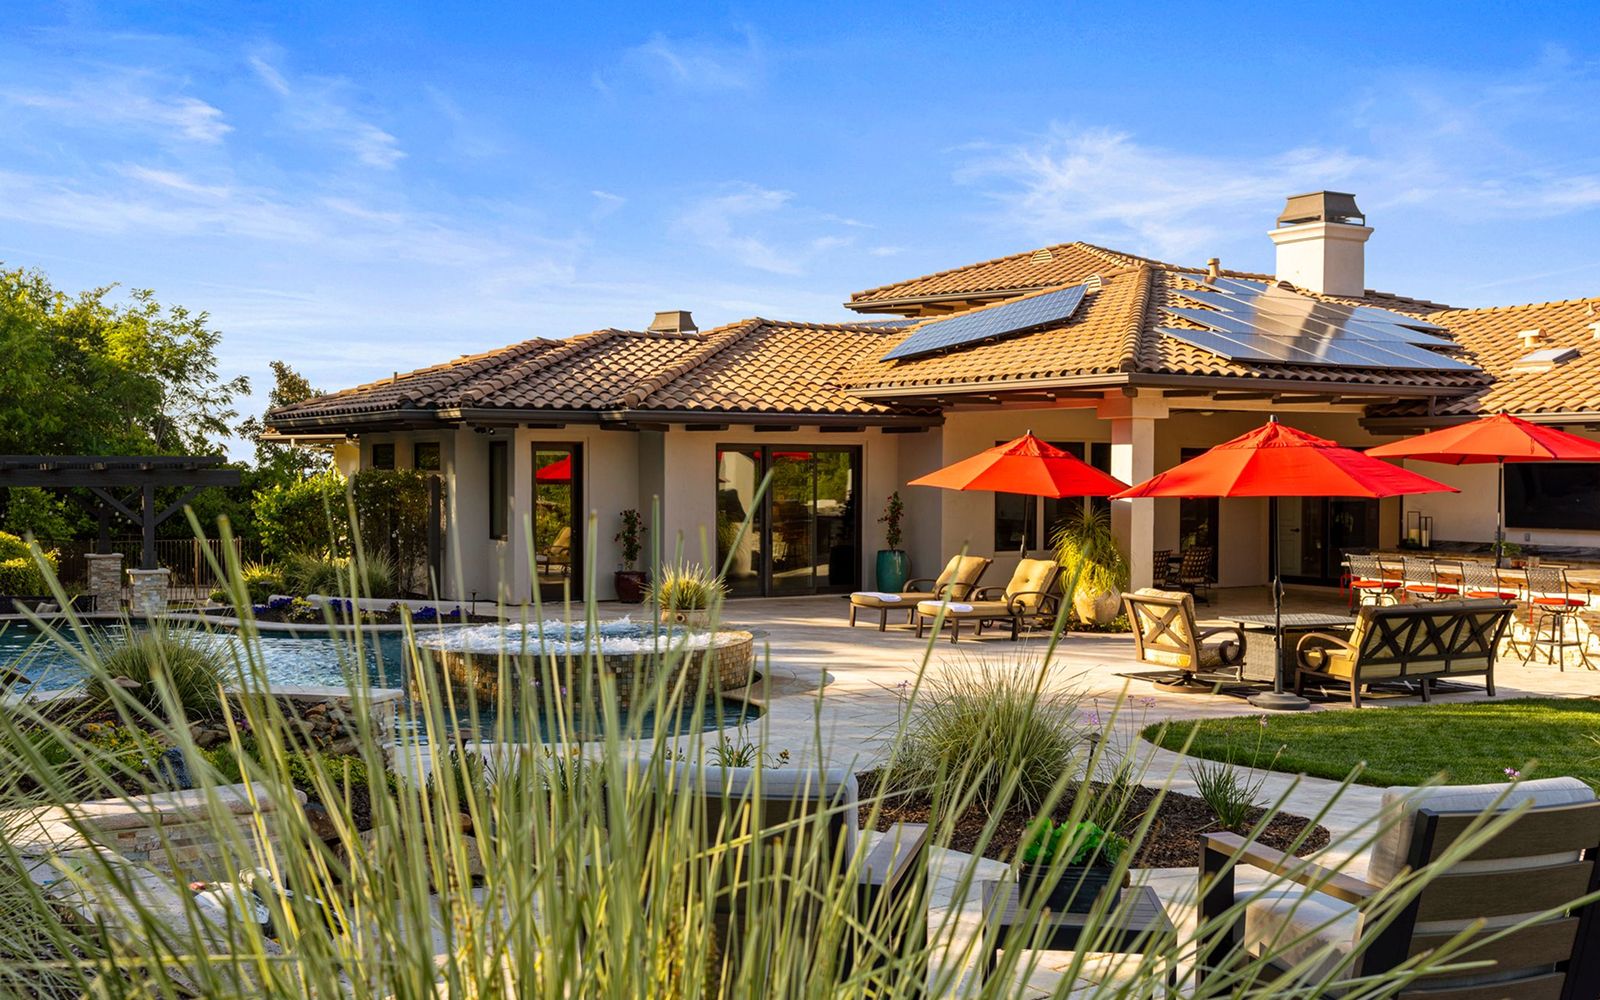
Serrano | Guard-Gated 4355 Gresham Drive $3,675,000 | 5 bed / 5 bath | 5,468 sq ft A 1.5-acre Serrano estate on two parcels. In Los Altos, $3.675M is median territory at 107% of list. In EDH's $2M-$5M segment, sellers are closing at 95.4% of list with 7.4 months of supply. This is the buyer's market the data describes. View Listing → |
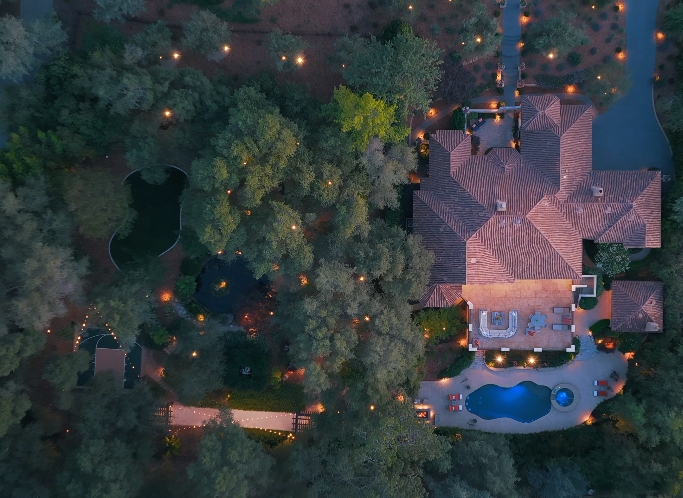
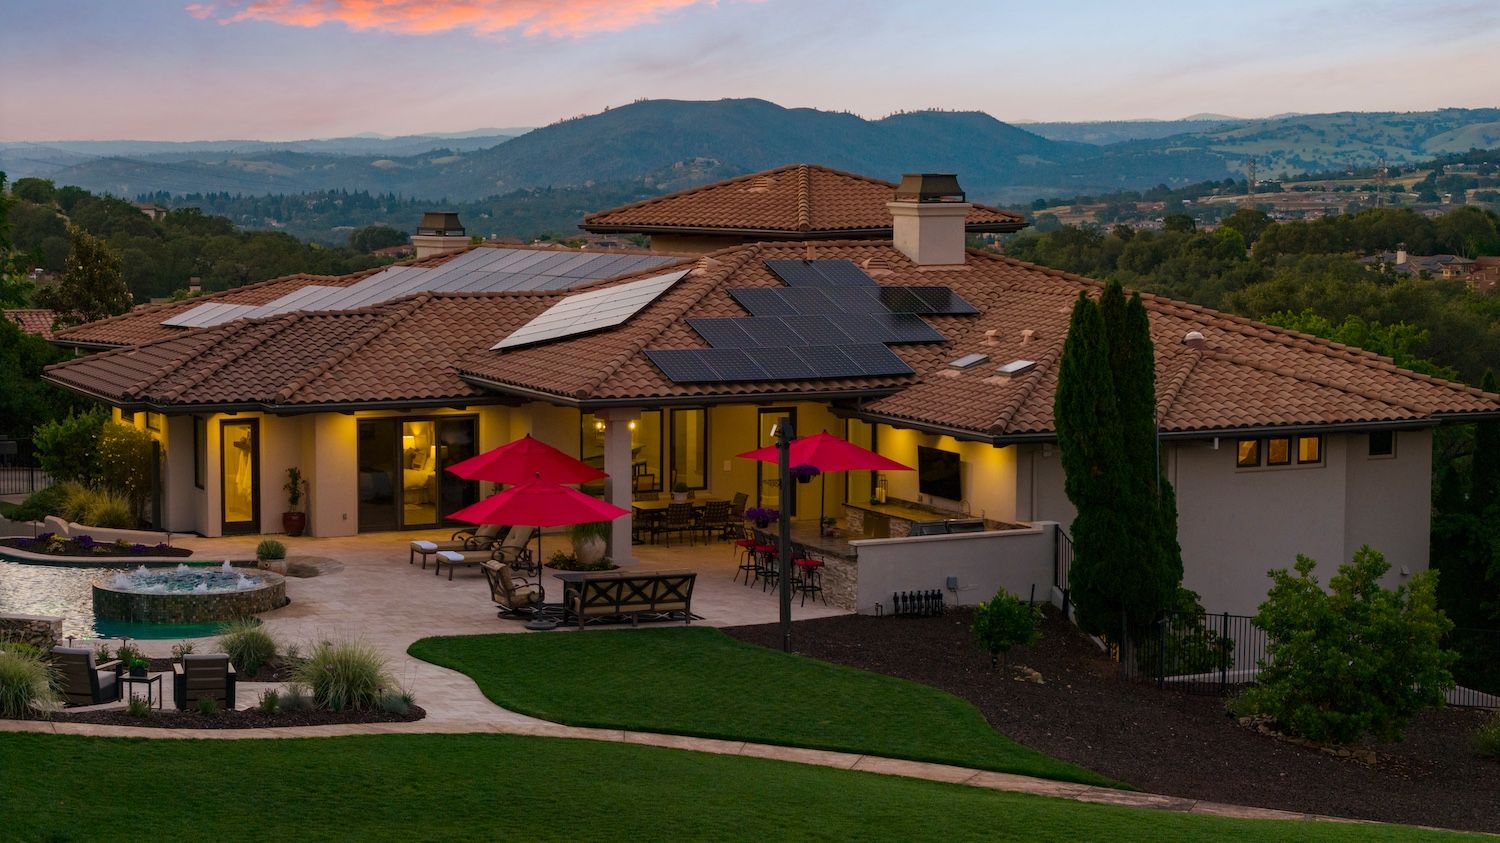
Serrano | Guard-Gated 5161 Greyson Creek Drive $3,100,000 | 5 bed / 5.5 bath | 5,092 sq ft 1.13 private acres in Serrano with a koi pond garden, covered pavilion, pool, and wine cellar. Mountain View's median SFR ran $2.9M in May 2026 at 107% of list. This segment in EDH has a 13% pending ratio and 7.4 months of supply. Patient buyers have real room here. View Listing → |
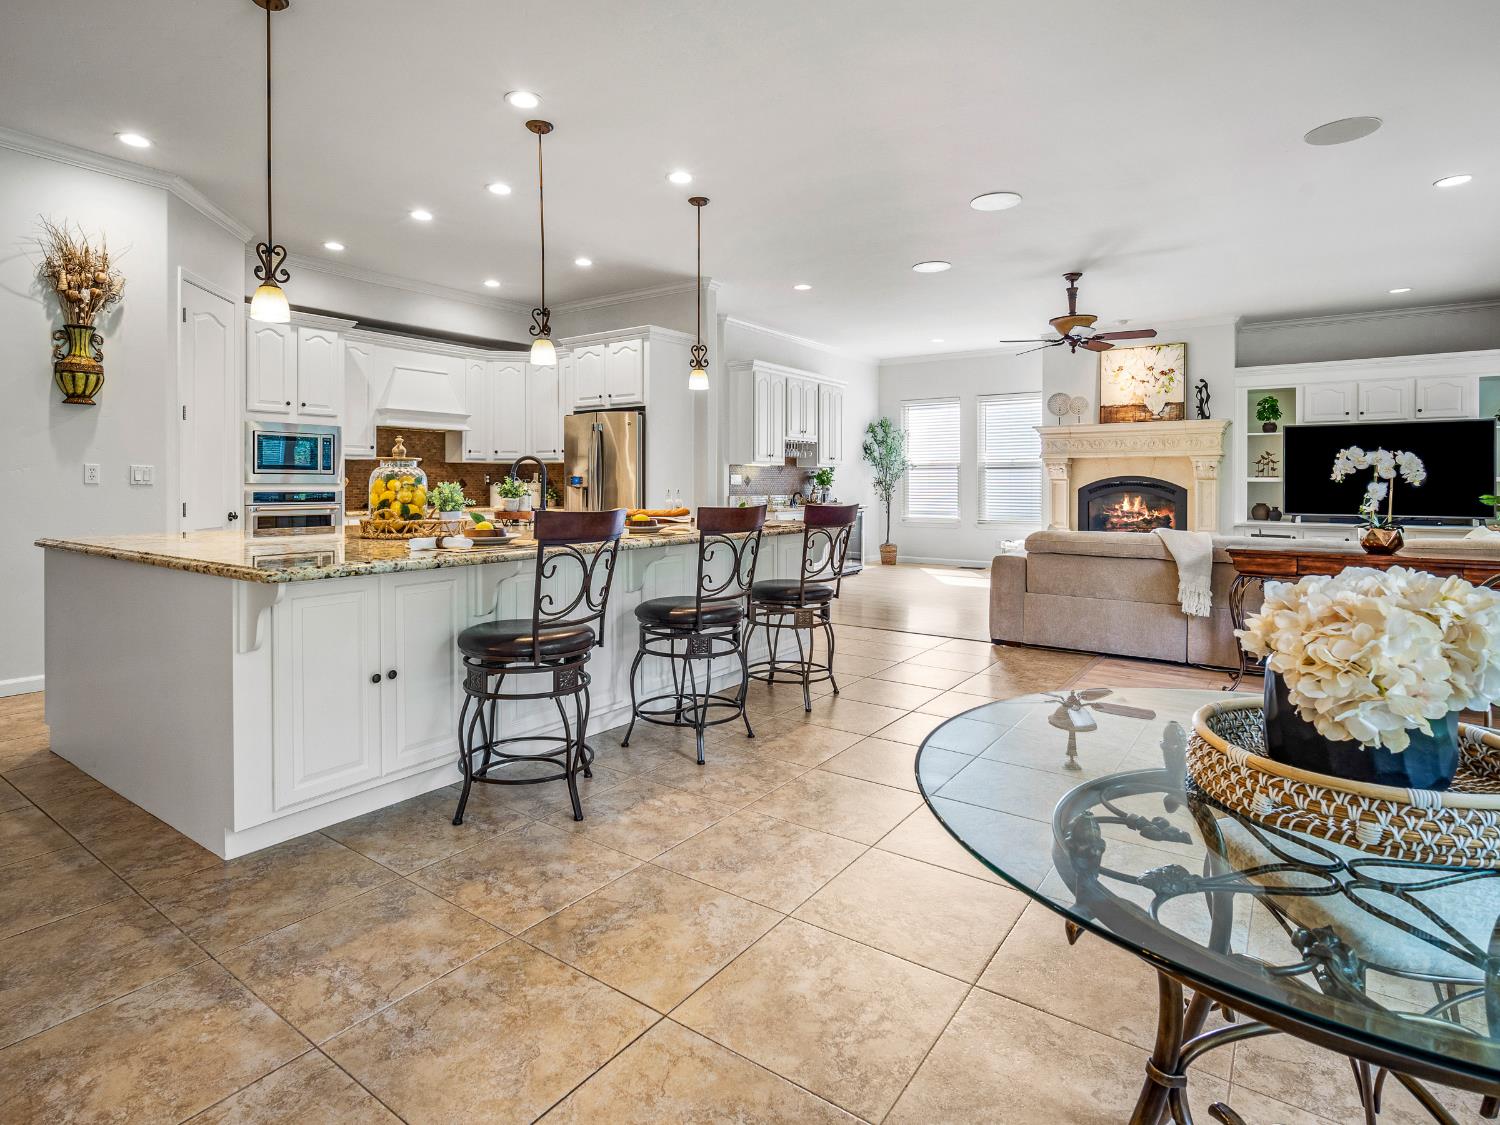
Francisco Oaks | Gated 336 Bodega Court $1,678,000 | 5 bed / 4 bath | 4,358 sq ft This price is below the San Jose median, where you'd be writing at 104% of list to compete. In the EDH $1.5M-$1.75M band, homes have closed at 100.3% of list with a 50% pending ratio. Be ready to move. This cul-de-sac pool home near Folsom Lake is priced in the market's most active segment. View Listing → |
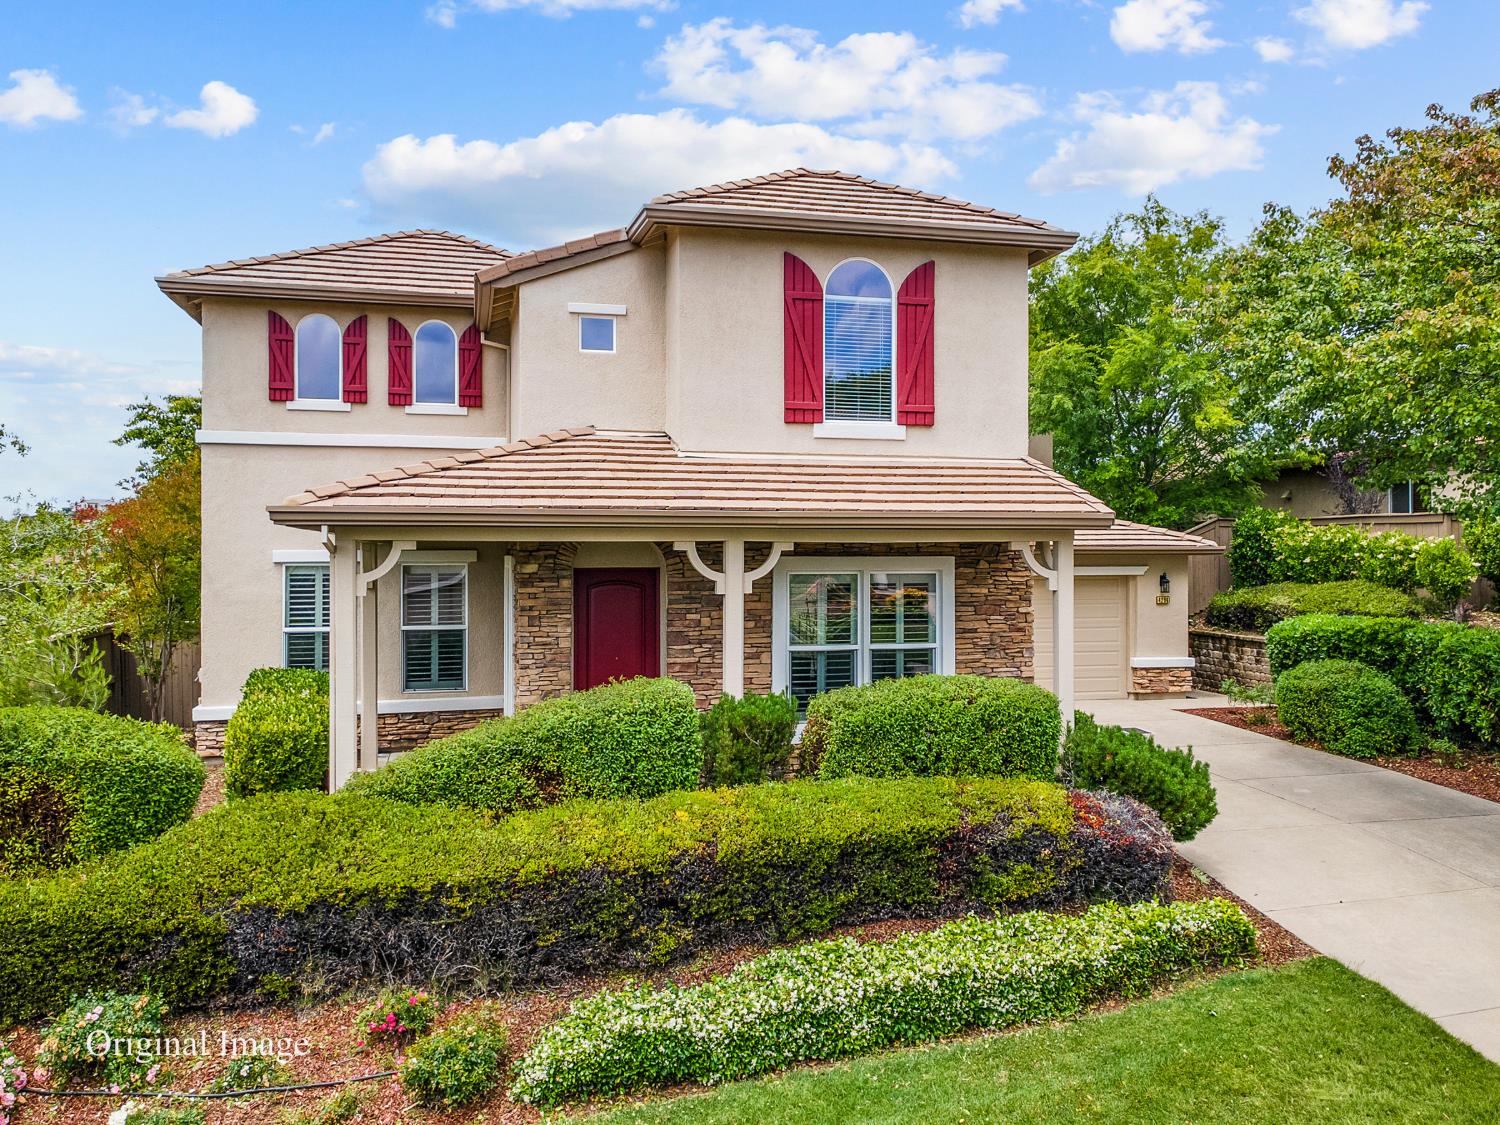
Serrano | Gated 4296 Arenzano Way $999,000 | 4 bed / 4 bath | 3,578 sq ft Behind the gates of Serrano, with a courtyard, pool and spa, hardwood floors, and an owner's suite with a private balcony. A separate ground-floor office with its own entry adds flexibility Bay Area buyers rarely find at comparable price points. Priced in a market where financing and inspections are still standard. View Listing → |
Frequently Asked Questions
What is the average home price in El Dorado Hills in 2026?
The average sale price for homes that closed in El Dorado Hills, CA over the three months ending June 24, 2026 was $1,080,139. Active listings as of June 24, 2026 averaged $1,565,066 in asking price. The market had 199 active listings and 2.8 months of supply on that date.
How does El Dorado Hills compare to Santa Clara County for home prices?
Santa Clara County's median SFR sale price was $2,050,000 in May 2026, nearly double El Dorado Hills' average closed price of $1,080,139 over the same general period. Santa Clara County buyers also paid 104% of list price on average, while El Dorado Hills buyers closed at 98.9% of list. At a $1.5M budget, a buyer is below the county median in Santa Clara County and in the top demand segment of El Dorado Hills.
Is El Dorado Hills a buyer's or seller's market right now?
As of June 24, 2026, El Dorado Hills has 2.8 months of total supply, balanced overall, but with a clear split by price. Below $1.75M, conditions favor sellers: pending ratios run 38-58% and supply sits at 2.1-2.7 months in the strongest bands. Above $2M, the market shifts to buyers: the $2M-$5M segment has 7.4 months of supply, a 13% pending ratio, and homes closing at 95.4% of list.
What price range is most competitive for buyers in El Dorado Hills?
The $750K-$1.75M range is the most active segment as of June 24, 2026. The $750K-$1M band has a 58% pending ratio and 2.1 months of supply. The $1.5M-$1.75M band has a 50% pending ratio with just 8 active listings, and homes in that range have closed at 100.3% of list over the past three months. Buyers in these segments should be pre-approved and ready to move within days of a well-priced home hitting the market.
How long does it take to sell a home in El Dorado Hills in 2026?
Homes that sold in El Dorado Hills over the three months ending June 24, 2026 averaged 33 days on market. The fastest-moving segments are $750K-$1.5M, where days on market runs 28-32 days. The $3M+ range takes considerably longer. Active listings in that range average 90+ days without going under contract, and some have been sitting 200+ days.
Is El Dorado Hills a good place for Bay Area transplants to buy?
The market data says yes, for buyers who want their budget to work harder than it does in Santa Clara County. A buyer exiting the Bay Area carries equity from one of the highest-value markets in California. In El Dorado Hills, that equity typically buys significantly more home, at a lower cost per square foot (roughly $350-$500 versus $1,148 in Santa Clara County), with a purchase process where financing, inspections, and negotiation are still standard below $2M. The experience of buying here is different. Most Bay Area buyers we work with notice it on their first offer.
Shannon and Jon Yoffie of Yoffie Real Estate Group track monthly market conditions across El Dorado Hills, Serrano, Blackstone, Folsom, and the surrounding Sacramento foothills. If you're evaluating a Bay Area relocation and want to know what your specific budget looks like in this market, a demand-band analysis is the right starting point.
See your demand band in El Dorado Hills →
Data sources: AreaPro Market Reports as of June 24, 2026 (El Dorado Hills, CA 95762); Santa Clara County Association of Realtors, May 2026 SFR statistics report; Realtor.com 7 Levels of Luxury Report, June 25, 2026. Point-in-time metrics (active listings, pending ratio, months of supply) reflect conditions as of June 24, 2026. Performance metrics (days on market, % of list price, average sold price, sold volume) represent the trailing 3-month period, March 25 - June 24, 2026. Santa Clara County metrics represent countywide SFR data for May 2026 only.

Shannon and Jon Yoffie
Co-Founders | Yoffie Real Estate Group | Keller Williams
or another way